

Predictive Modeling.
9.2 million US homes still have a lead pipe. Every utility must know exactly which ones by November 2027, then replace them all within a decade. I built a self-serve tool that turns 120Water's internal lead science into something any utility can run on its own.
The real thing. Not a screenshot.
Every screen below is fully interactive, built conversationally, 41 versions in. Best on desktop.
Lead pipes don't sit under every home equally.
Lead pipes cluster in older, lower-income communities. That's why federal funding is earmarked for these systems specifically, not a bonus, a requirement.
Budget doesn't change the deadline.
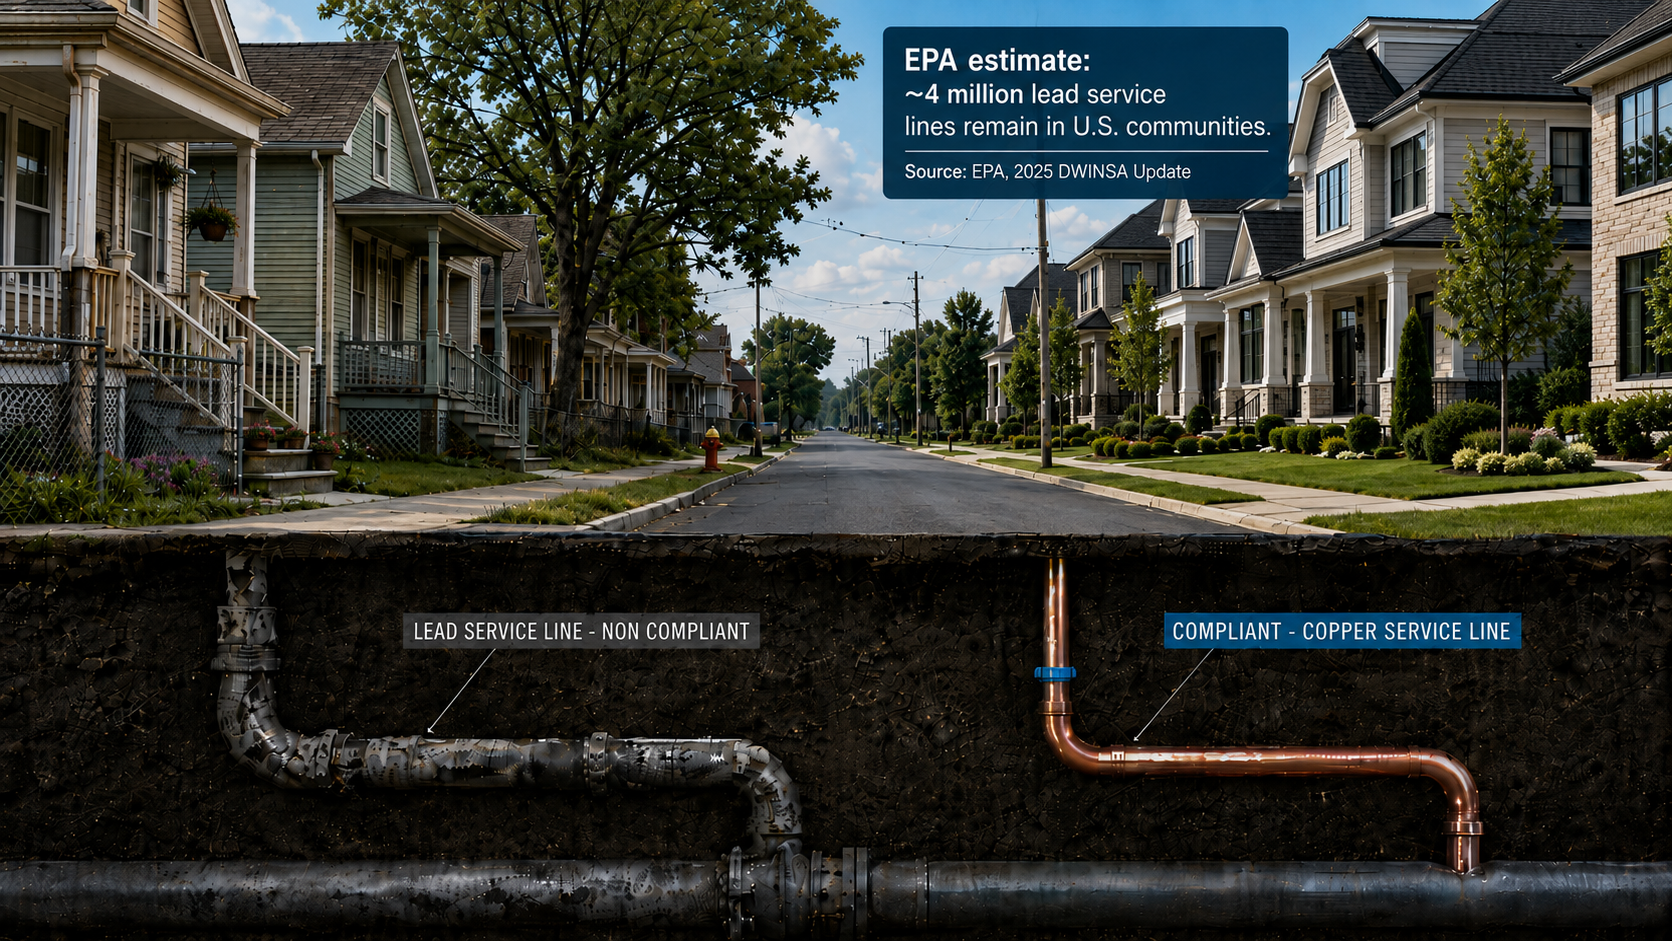
The science existed. Nobody outside 120Water could touch it.
120Water already had a model that could score every unknown line. It just lived outside the product: CSV exports, manual review, a re-upload, run by a person, one utility at a time.
Real machine learning, wrapped in a white-glove service that doesn't scale to every utility racing the same deadline.
Four testing sessions. The same three problems, every time.
We started with a number. Show a utility their model score, they'd know where to send crews. Two customers and two internal reviewers tested that bet. The same three problems showed up anyway.
Small team. Real deadline pressure.
The same person showed up every time: a non-technical utility employee, wearing several hats, no data science background, and no budget to hire one.
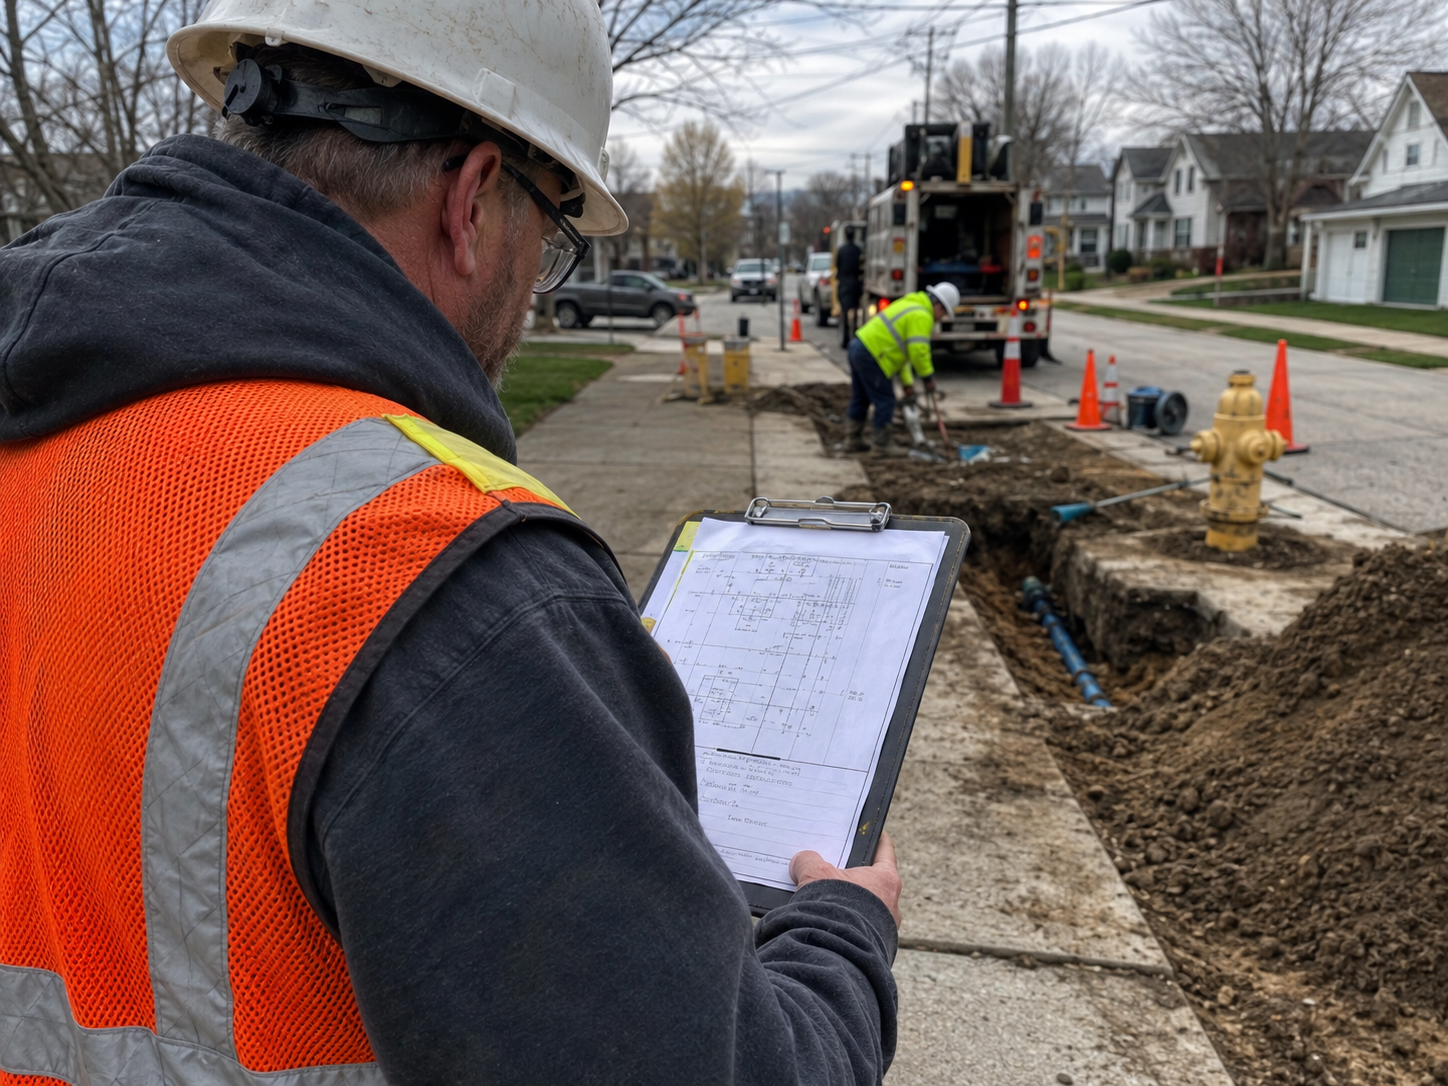
It sucks to review 700 lines, but I'd rather take the time to review them one at a time than mess up 700 locations.
Internal Product Discussion, on why bulk actions stay off by default for high-risk data
Not an interface problem. A trust problem.
A wrong call sends a crew to the wrong yard, or skips the one with lead. Automate where a wrong call is cheap. Make someone say yes where it isn't.
Three areas. One self-serve platform.
Each area replaces a manual step. Data Quality Review carries all three findings above and shipped first, on purpose. It helps every customer, not just the ones who pay for the planner.
Three rules governed every decision.
Never say "predictive" to a free customer. Hover to reduce complexity, never to remove information. One color means one thing, everywhere. Everything else followed from those three.
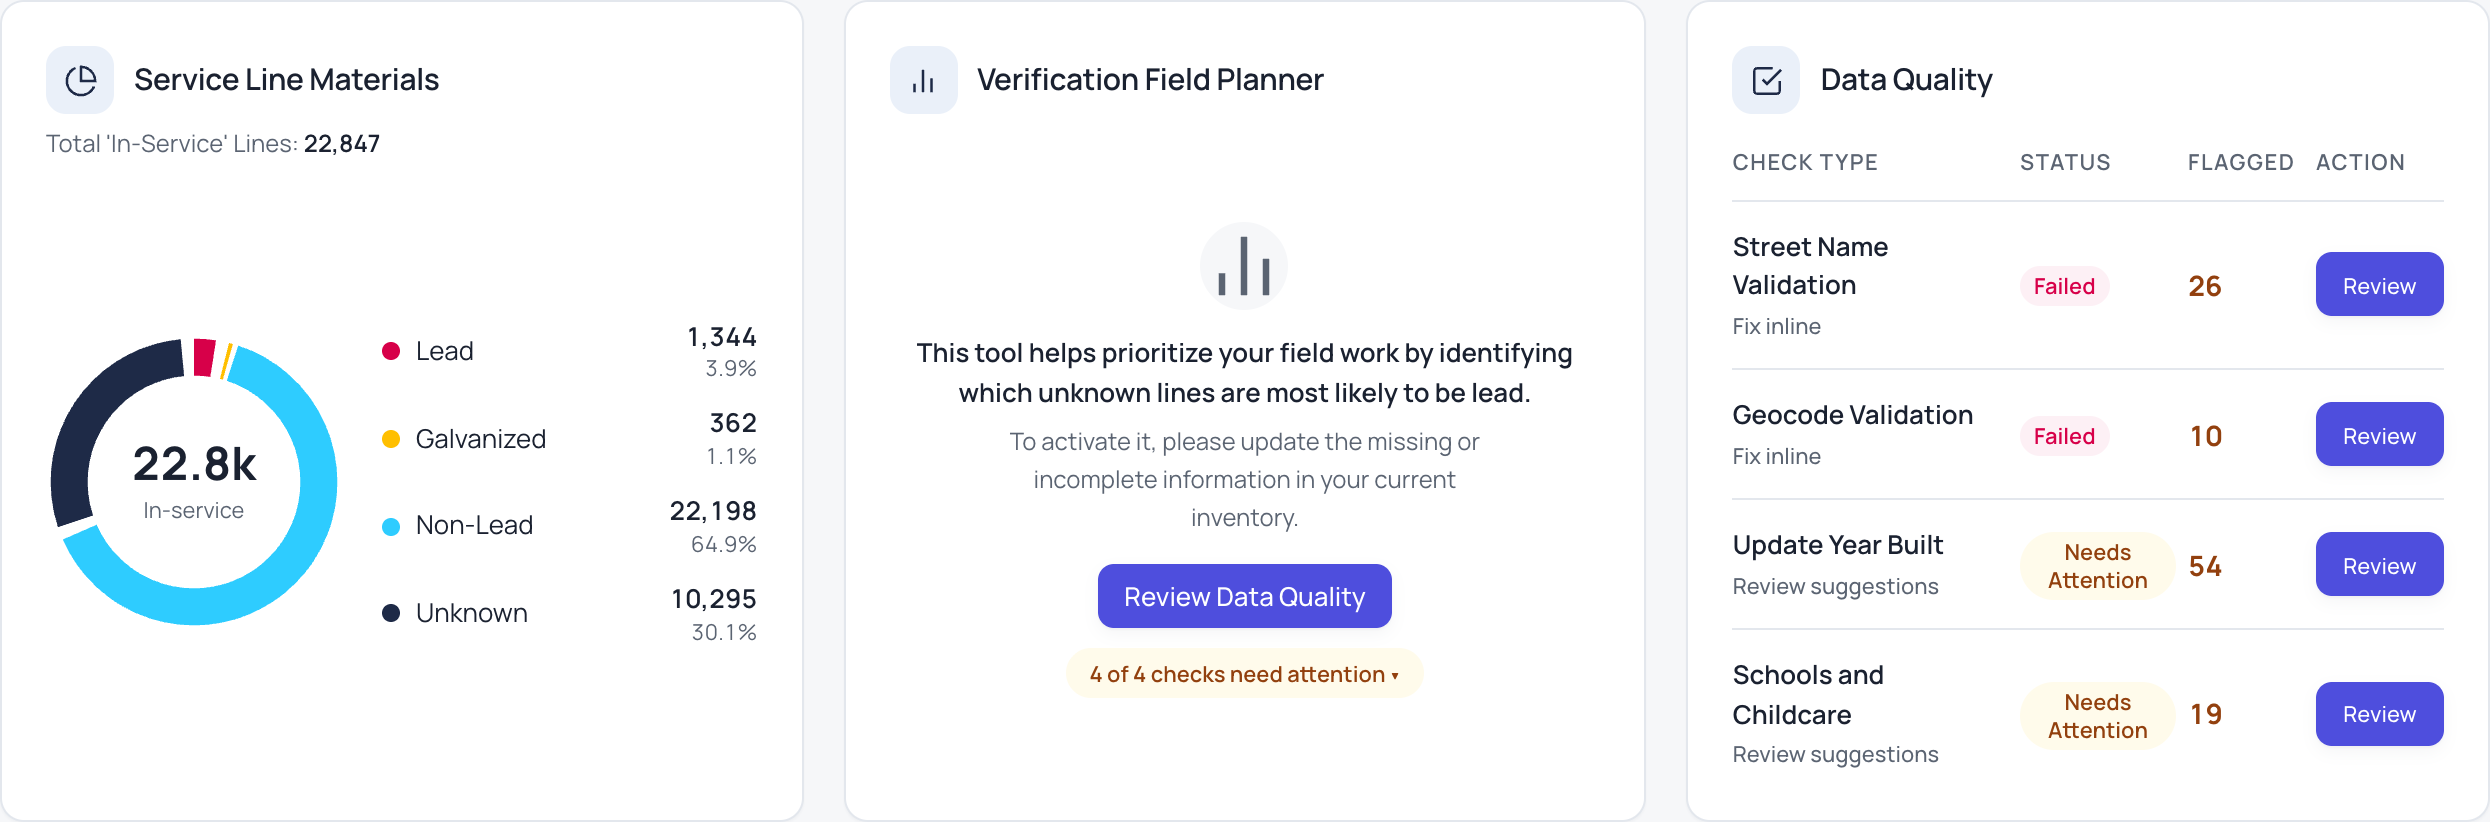
A utility can't fix what it can't see. So the checks come first.
Three checks gate the planner: real addresses, real coordinates, real build years. Fail one and it stays locked, the same checks 120Water used to run by hand, now self-serve.
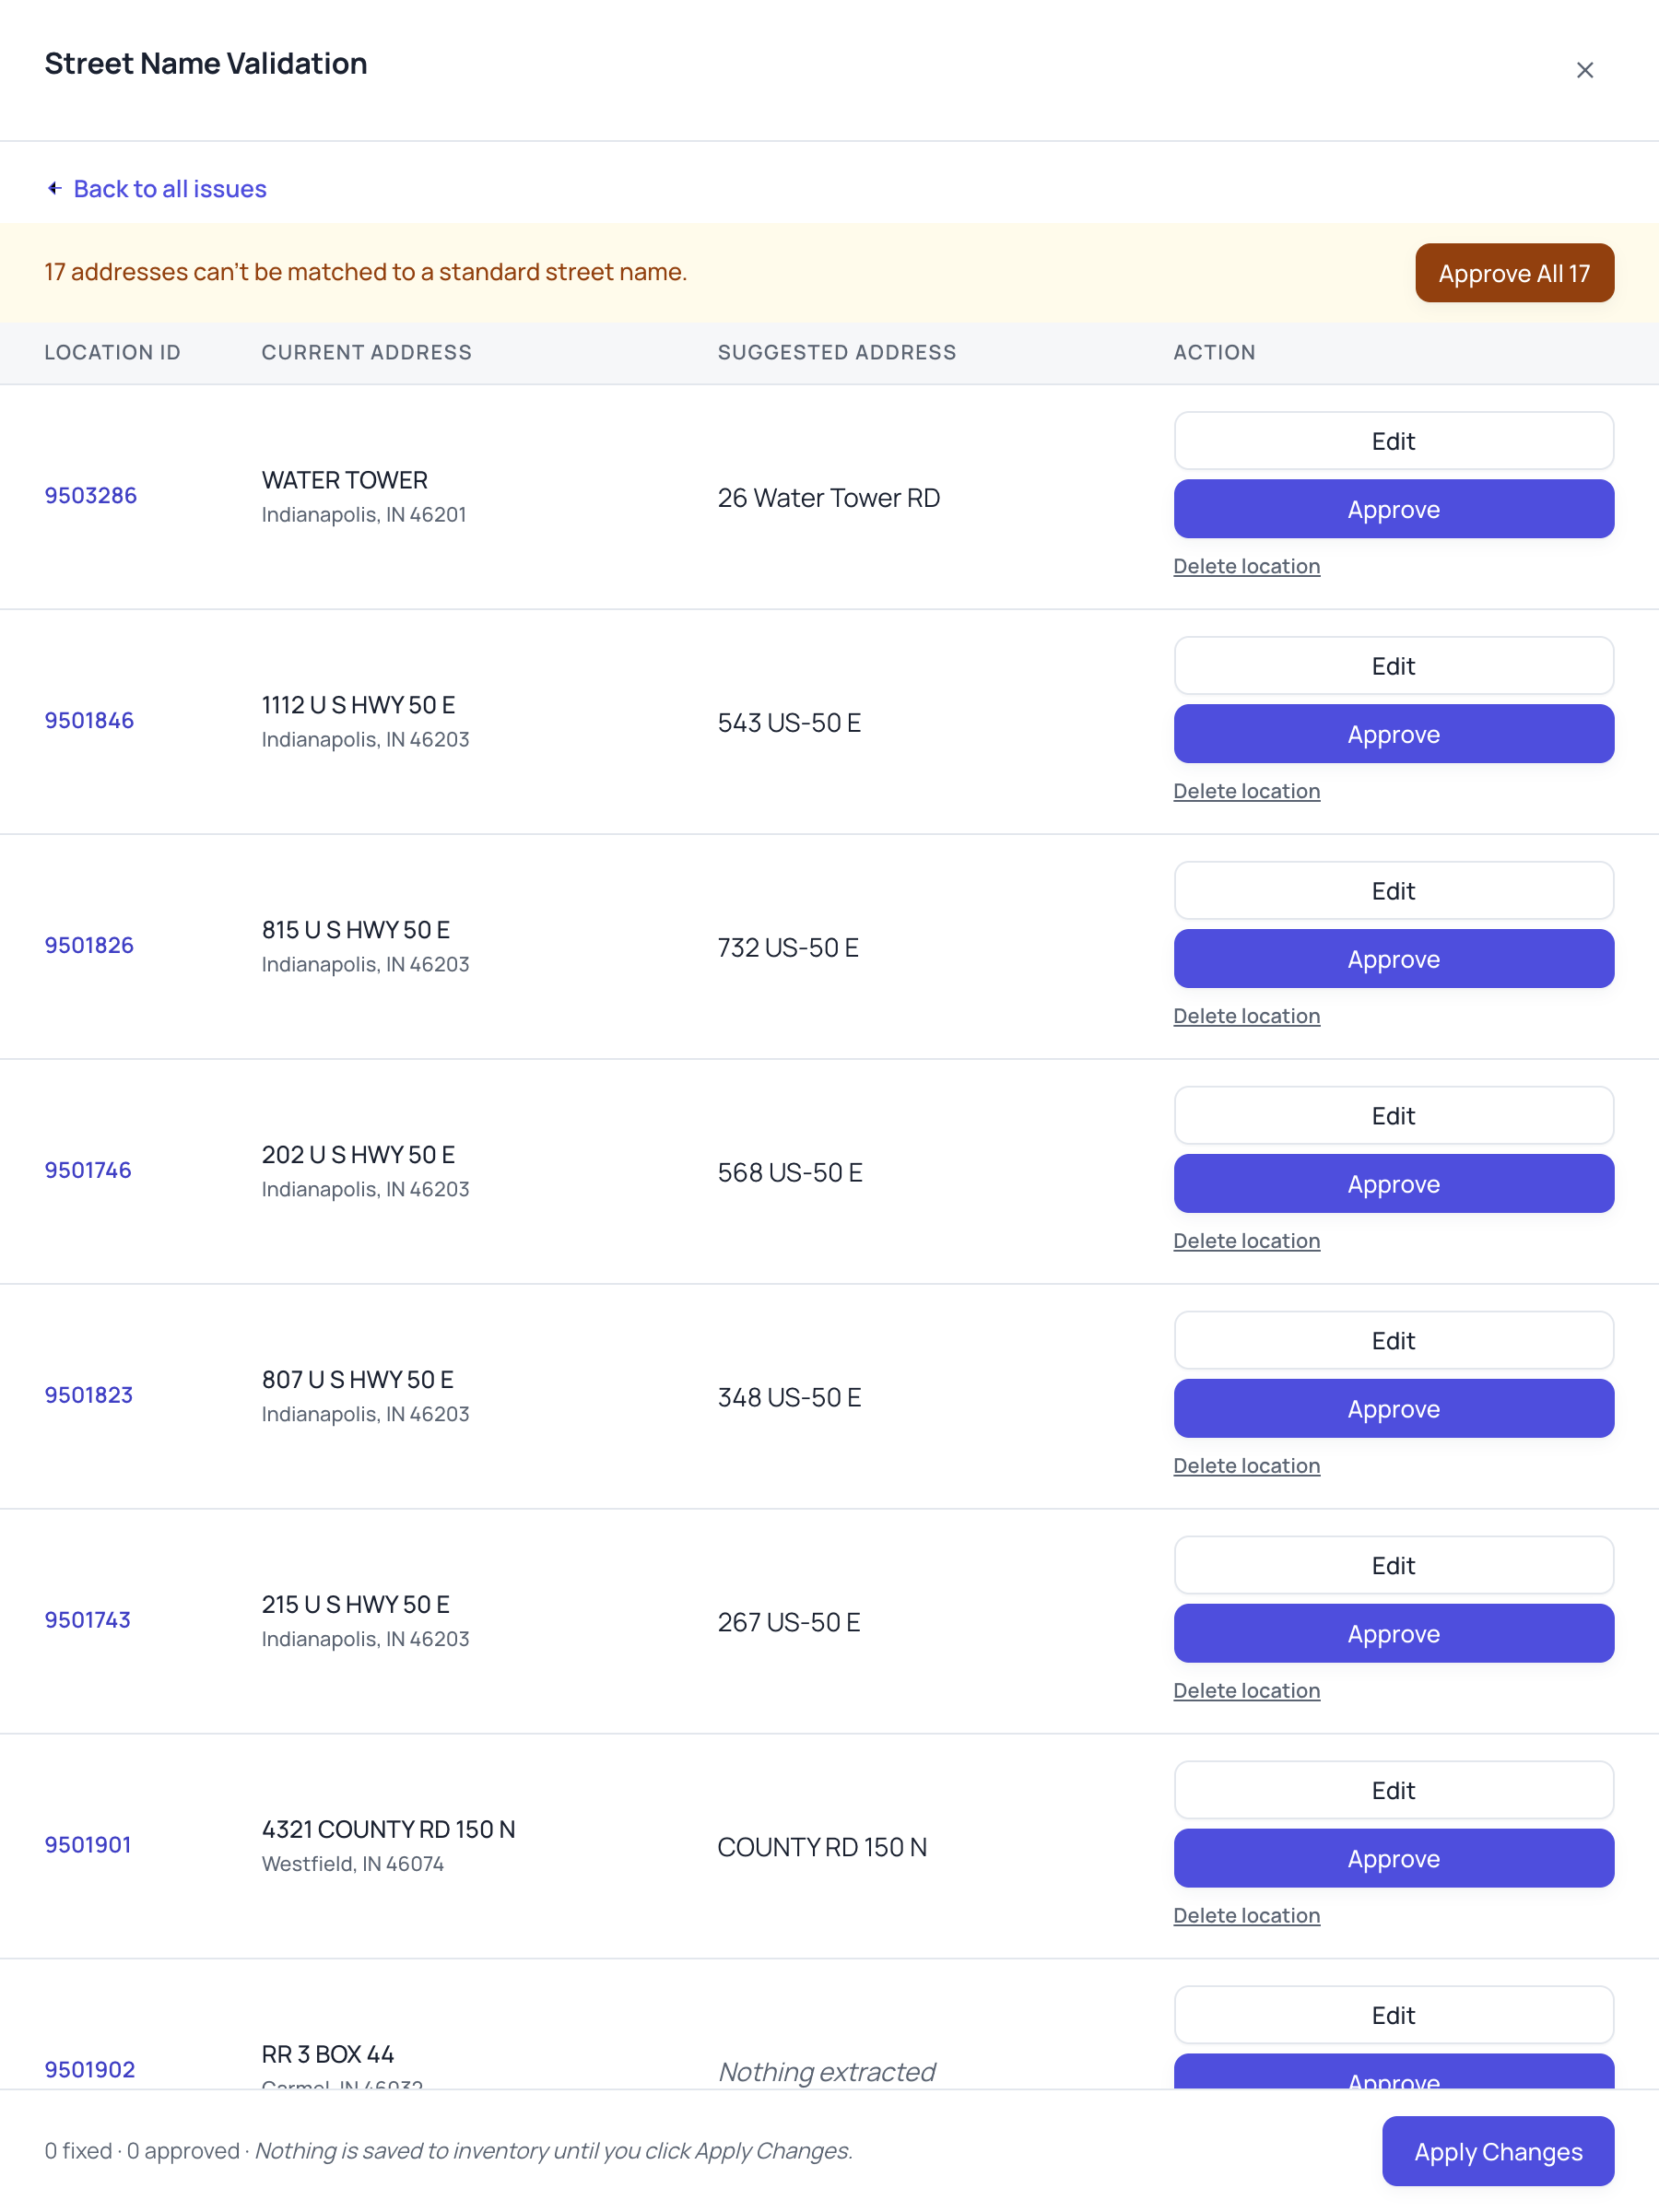
An address a computer can't read breaks every check that runs after it.
"WATER TOWER" isn't a street name. Neither is a rural route with no house number. Both show up in real inventories, and both used to silently break every check downstream.
Suggest, never auto-apply. A person still approves, edits, or deletes each one.
Sometimes the year a pipe went into the ground is the only evidence you need.
Lead pipe stopped being legal in 1986. Match an Unknown line to a real build year past that date, and it reclassifies with no truck roll required.
One exception: a line already field-verified Lead never gets overruled by a tax record. Flagged, excluded from Accept All, human only.
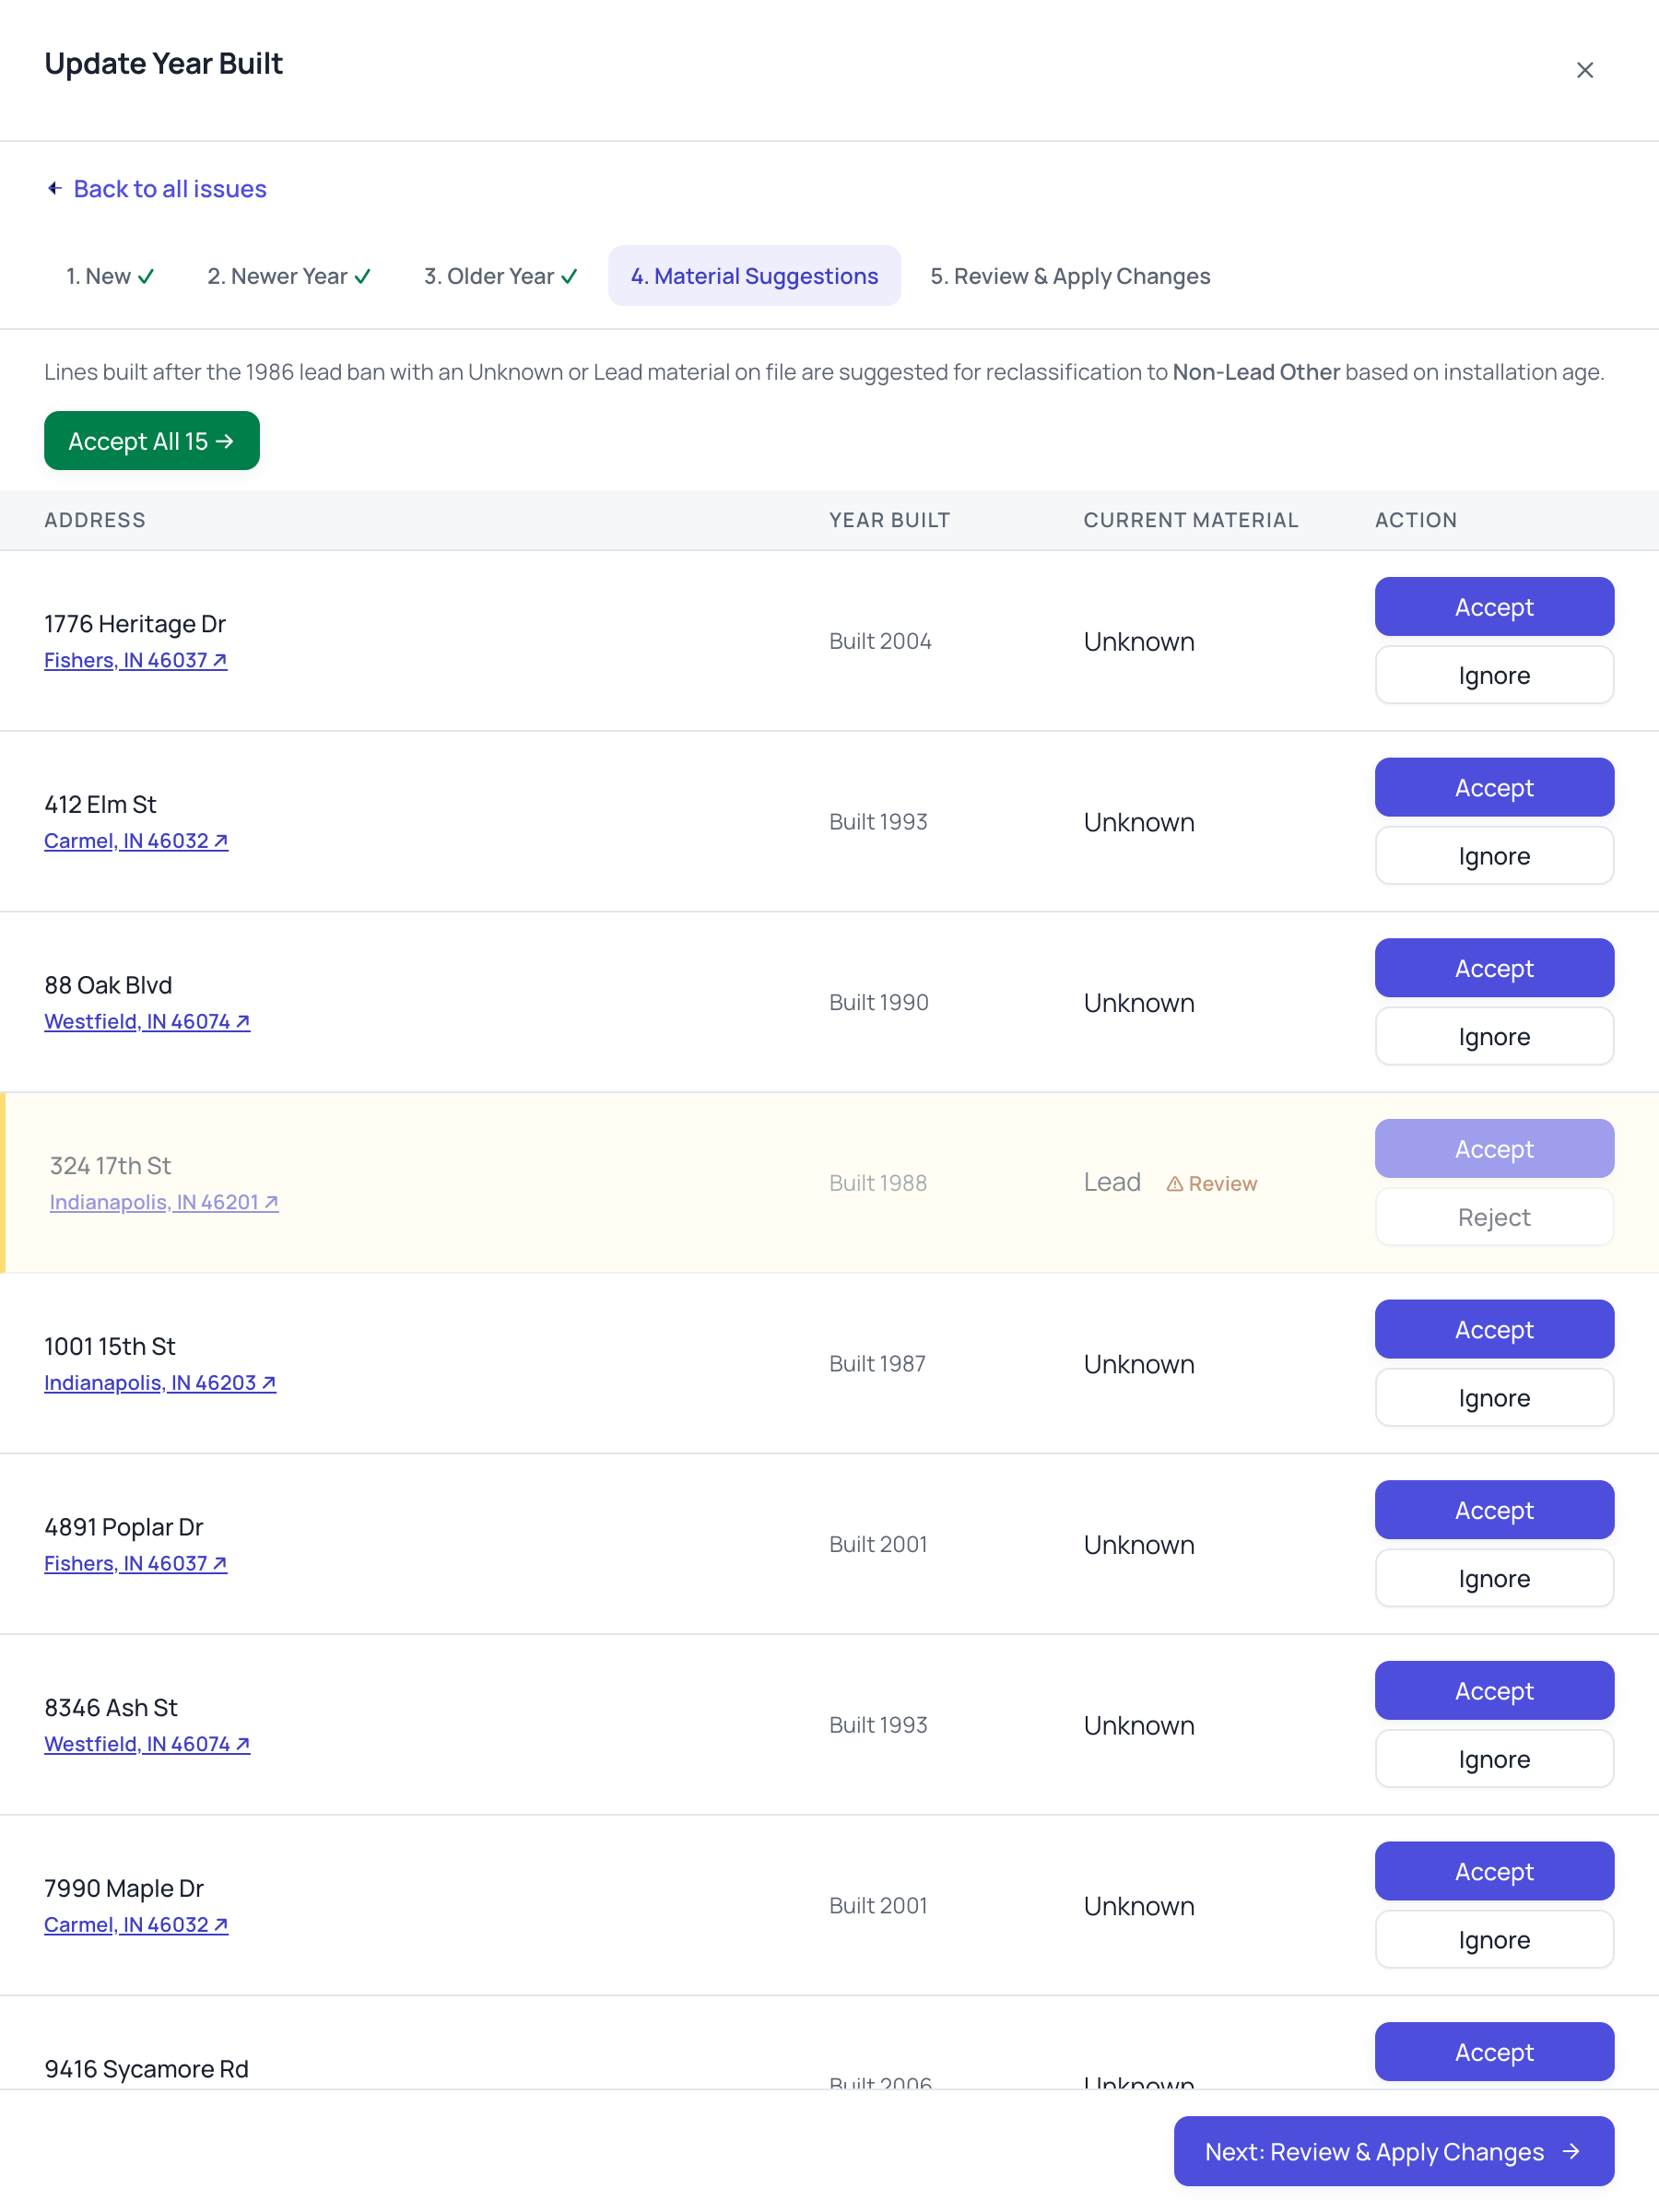
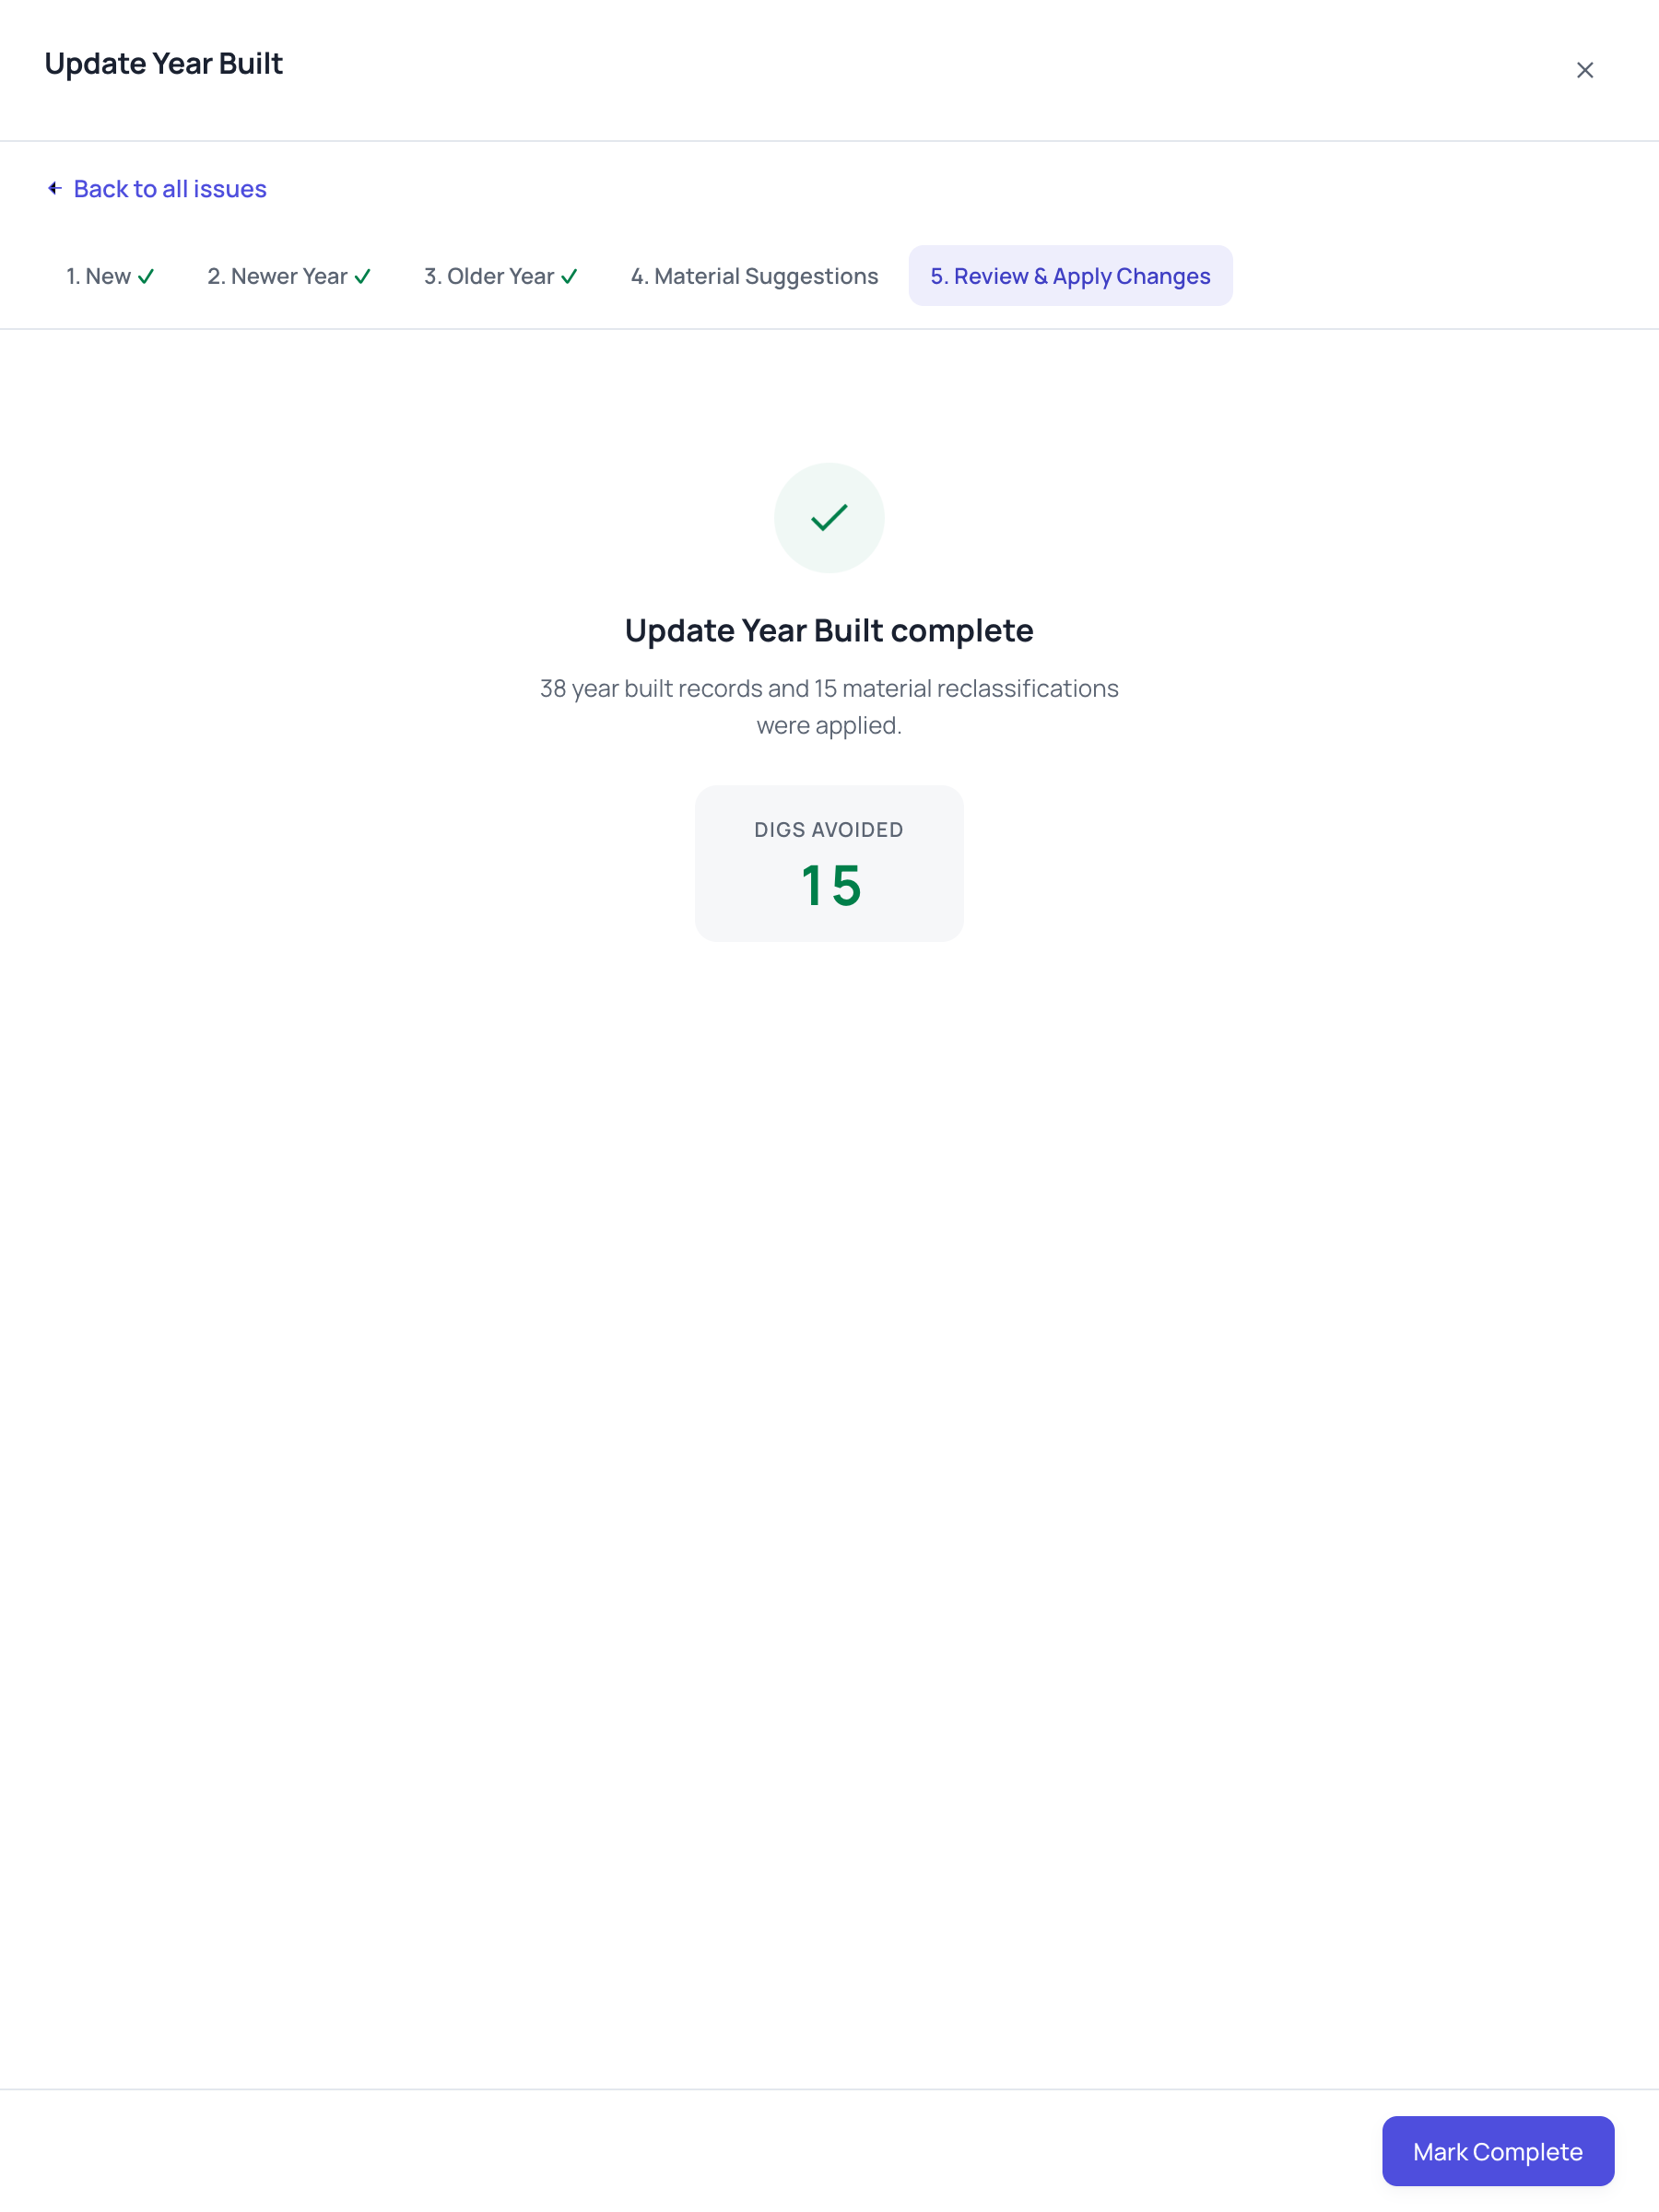
Nothing saves until Apply Changes. Then it's counted: every reclassified line is a property nobody has to dig up.
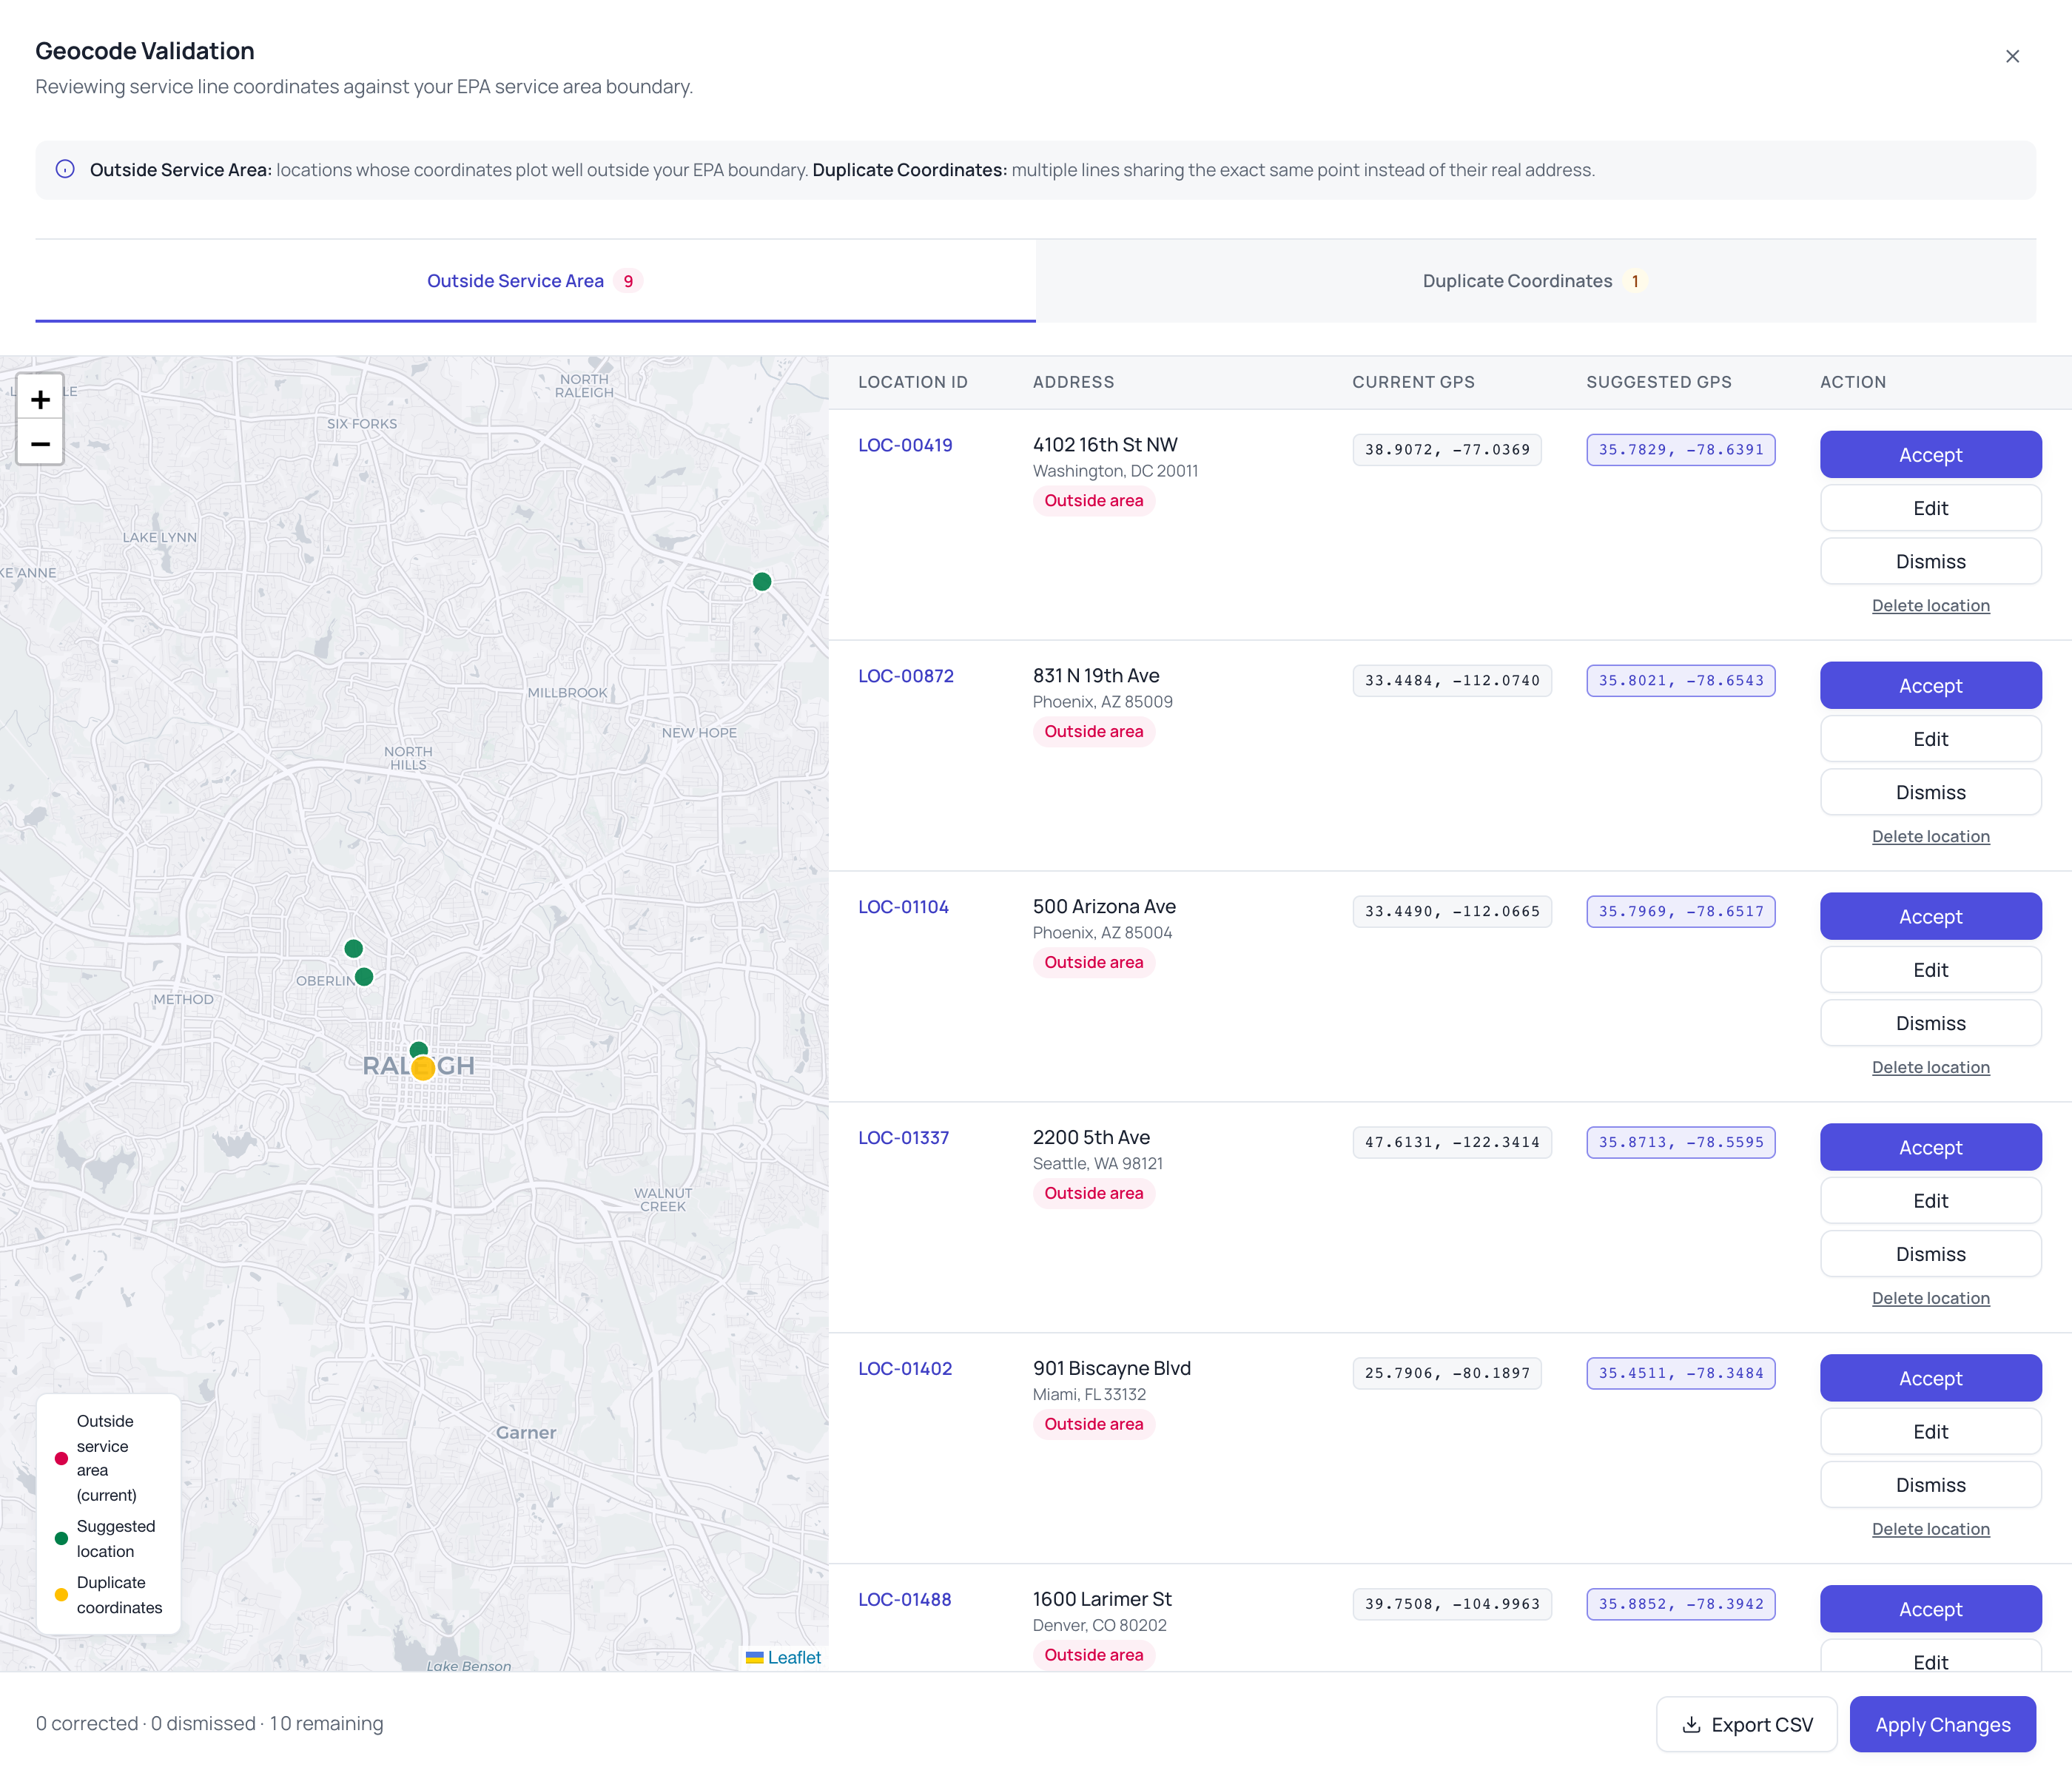
If the map is wrong, the crew shows up at the wrong house.
A bad coordinate doesn't vanish, it sends a crew to the wrong city. These pins plot in DC, Phoenix, Seattle, Miami, hundreds of miles outside the actual service area.
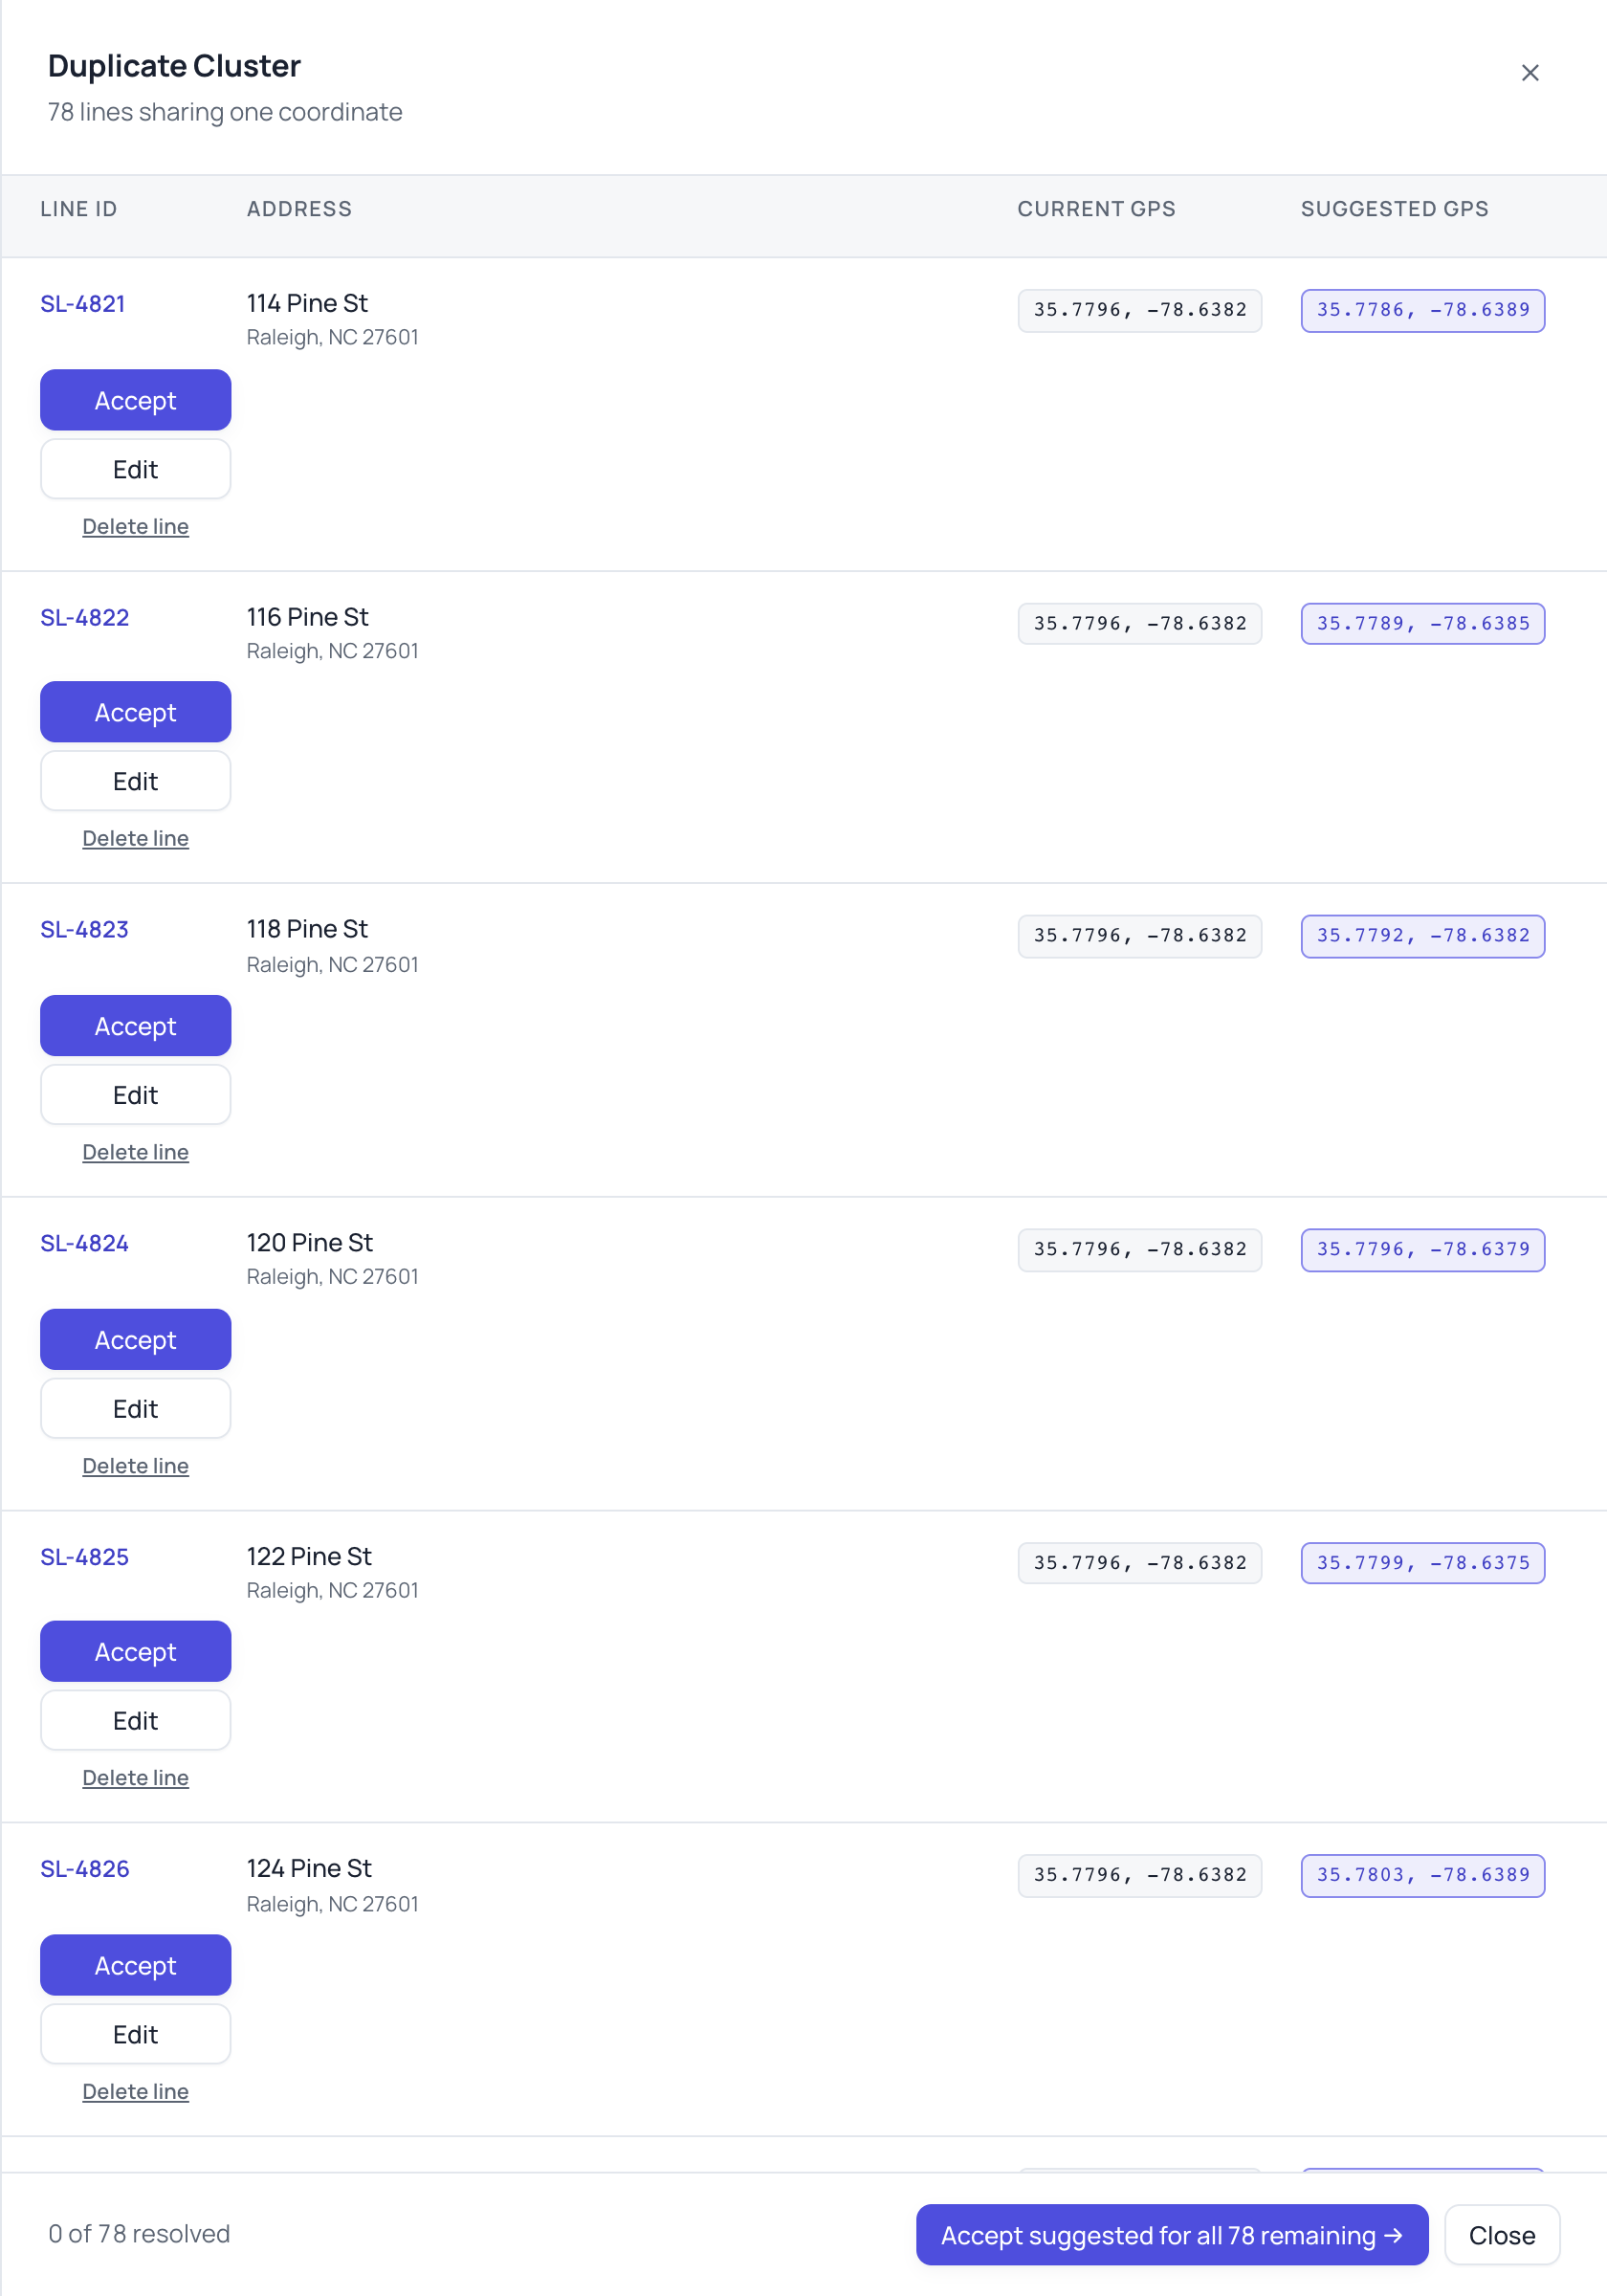
Two lines sharing one coordinate can be a duplex. Dozens is a geocoder giving up, caught at cluster scale, not one row at a time.
None of this came from a hunch. Every rule is copied from the acceptance criteria I was handed. When a rule looks oddly specific, someone already got burned by the version without it.
No percentage, on purpose.
Three buckets instead of a raw score: Higher Probability Non-Lead, Inconclusive, Higher Probability Lead. A number alone doesn't tell a utility where to send a crew.
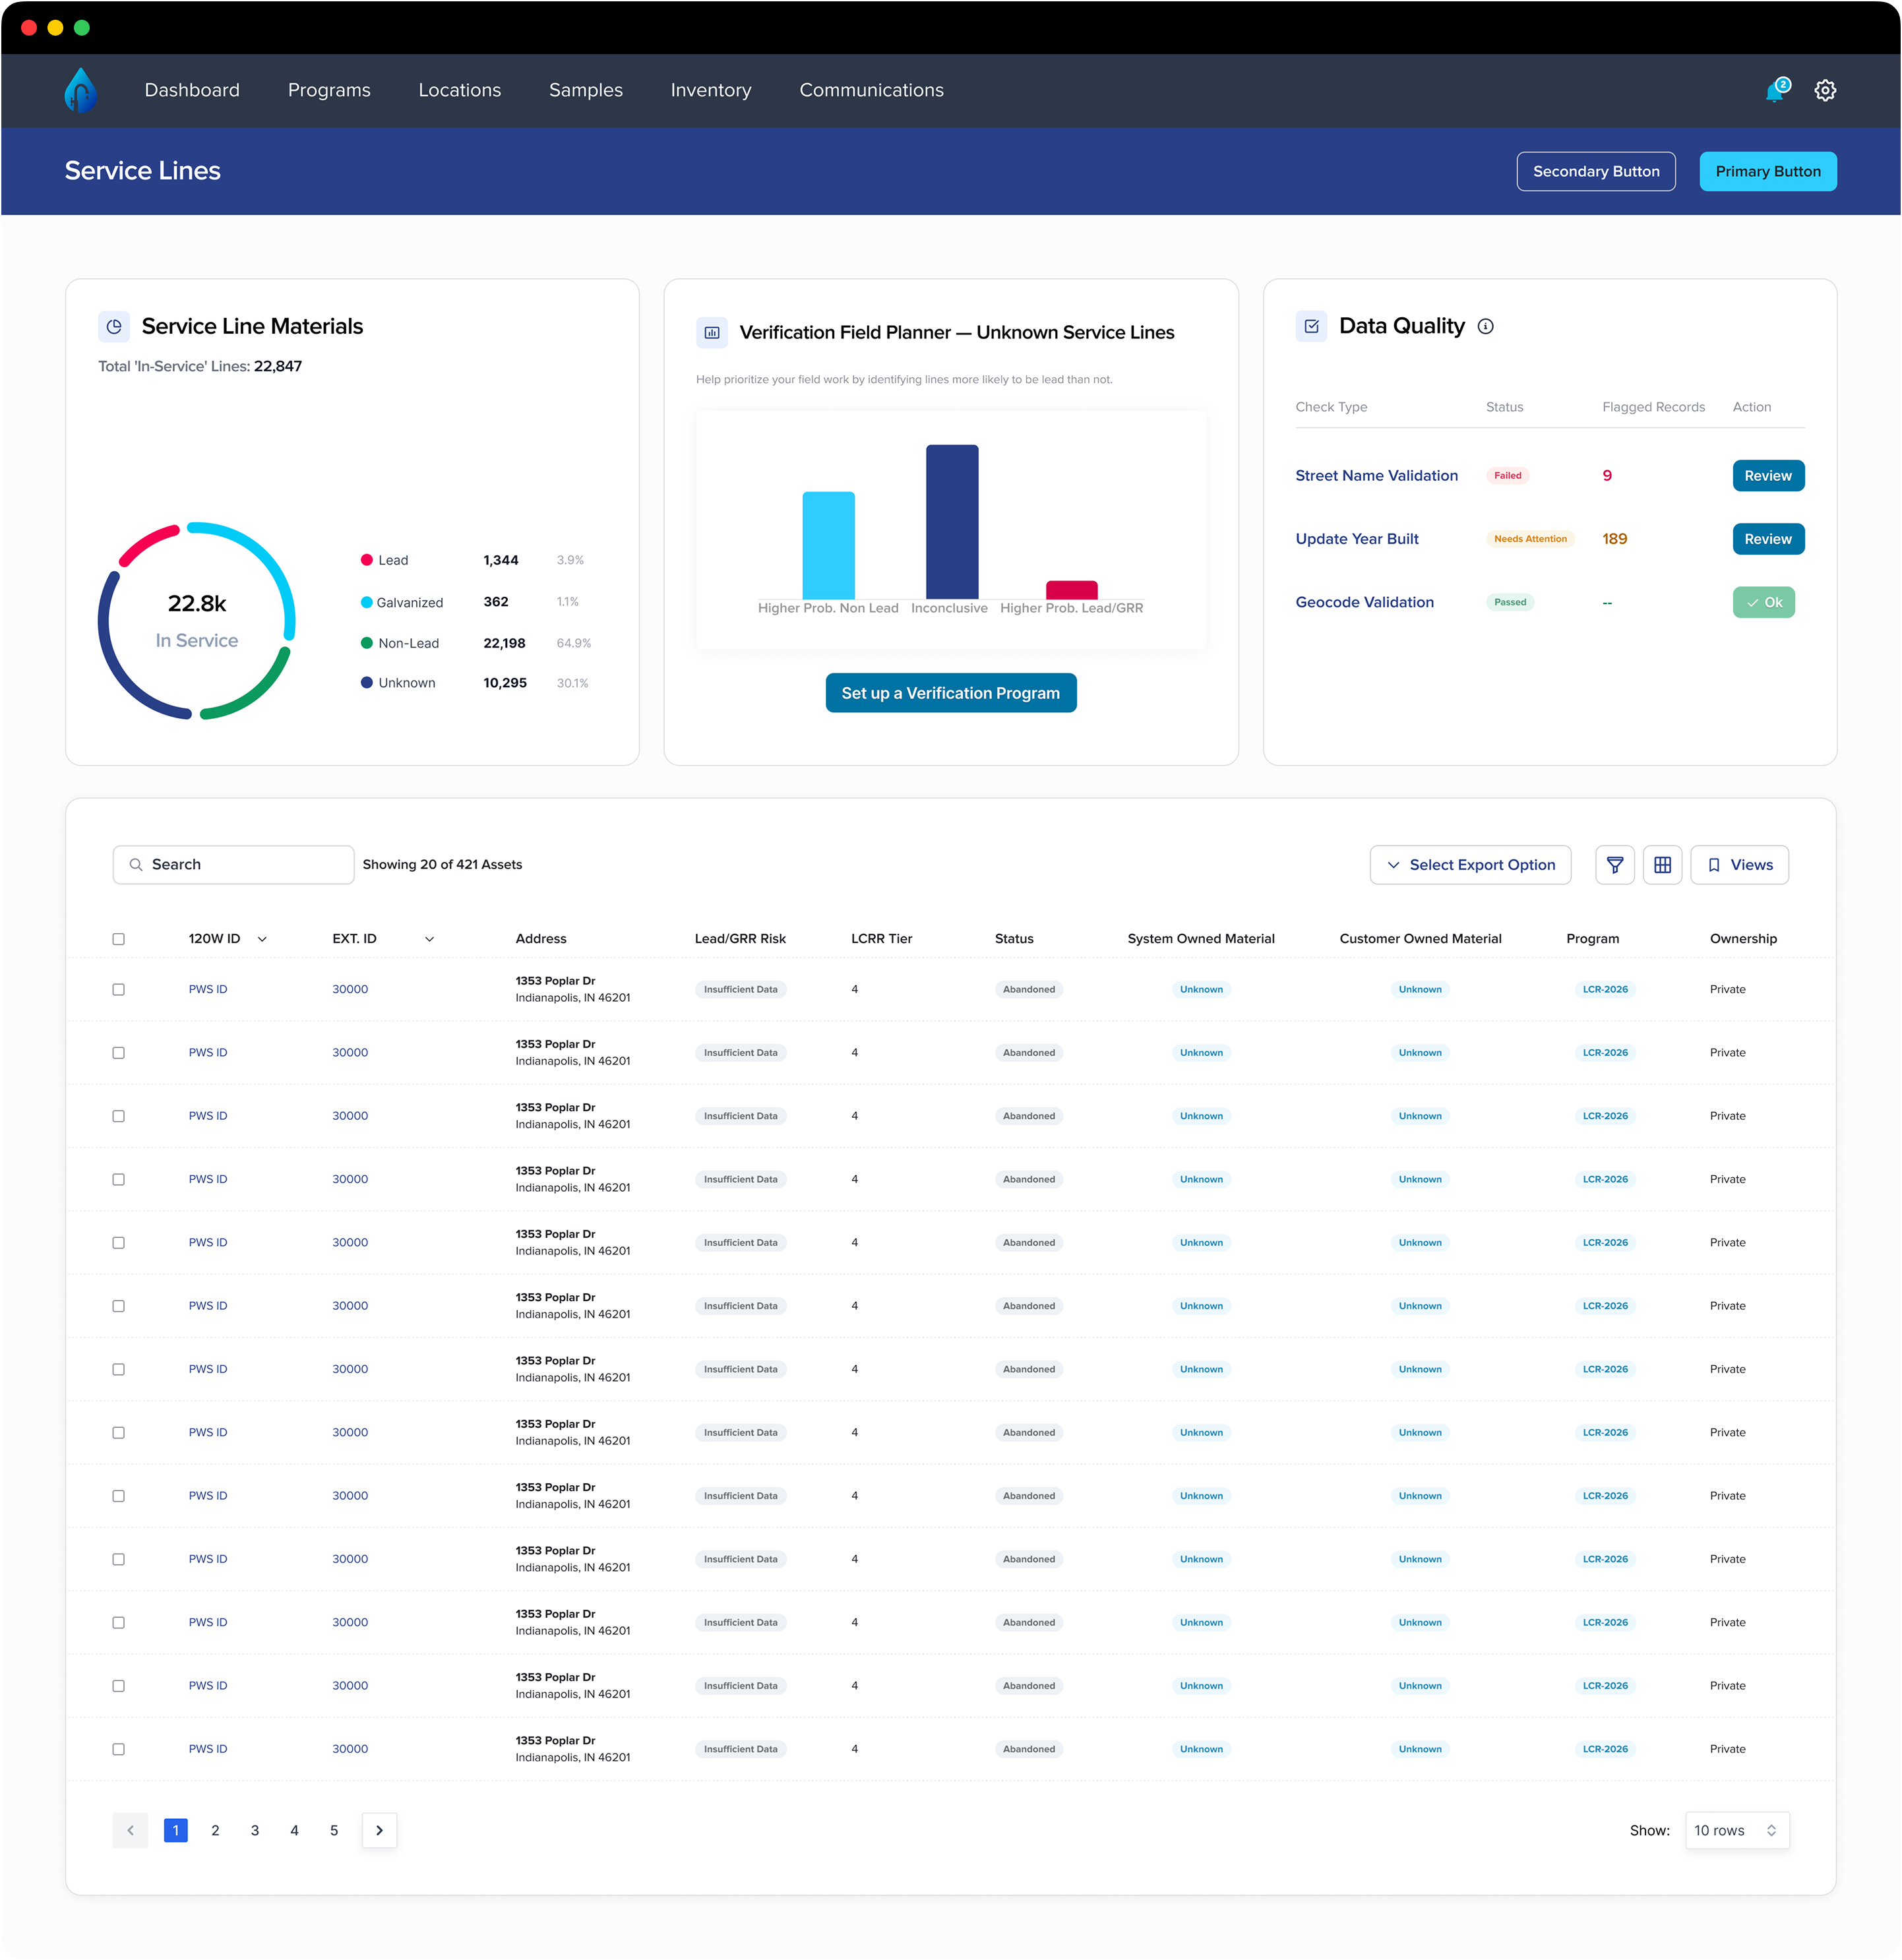
Everything that matters, above the fold.
Materials, data quality, and prediction. One page instead of three calls to 120Water.
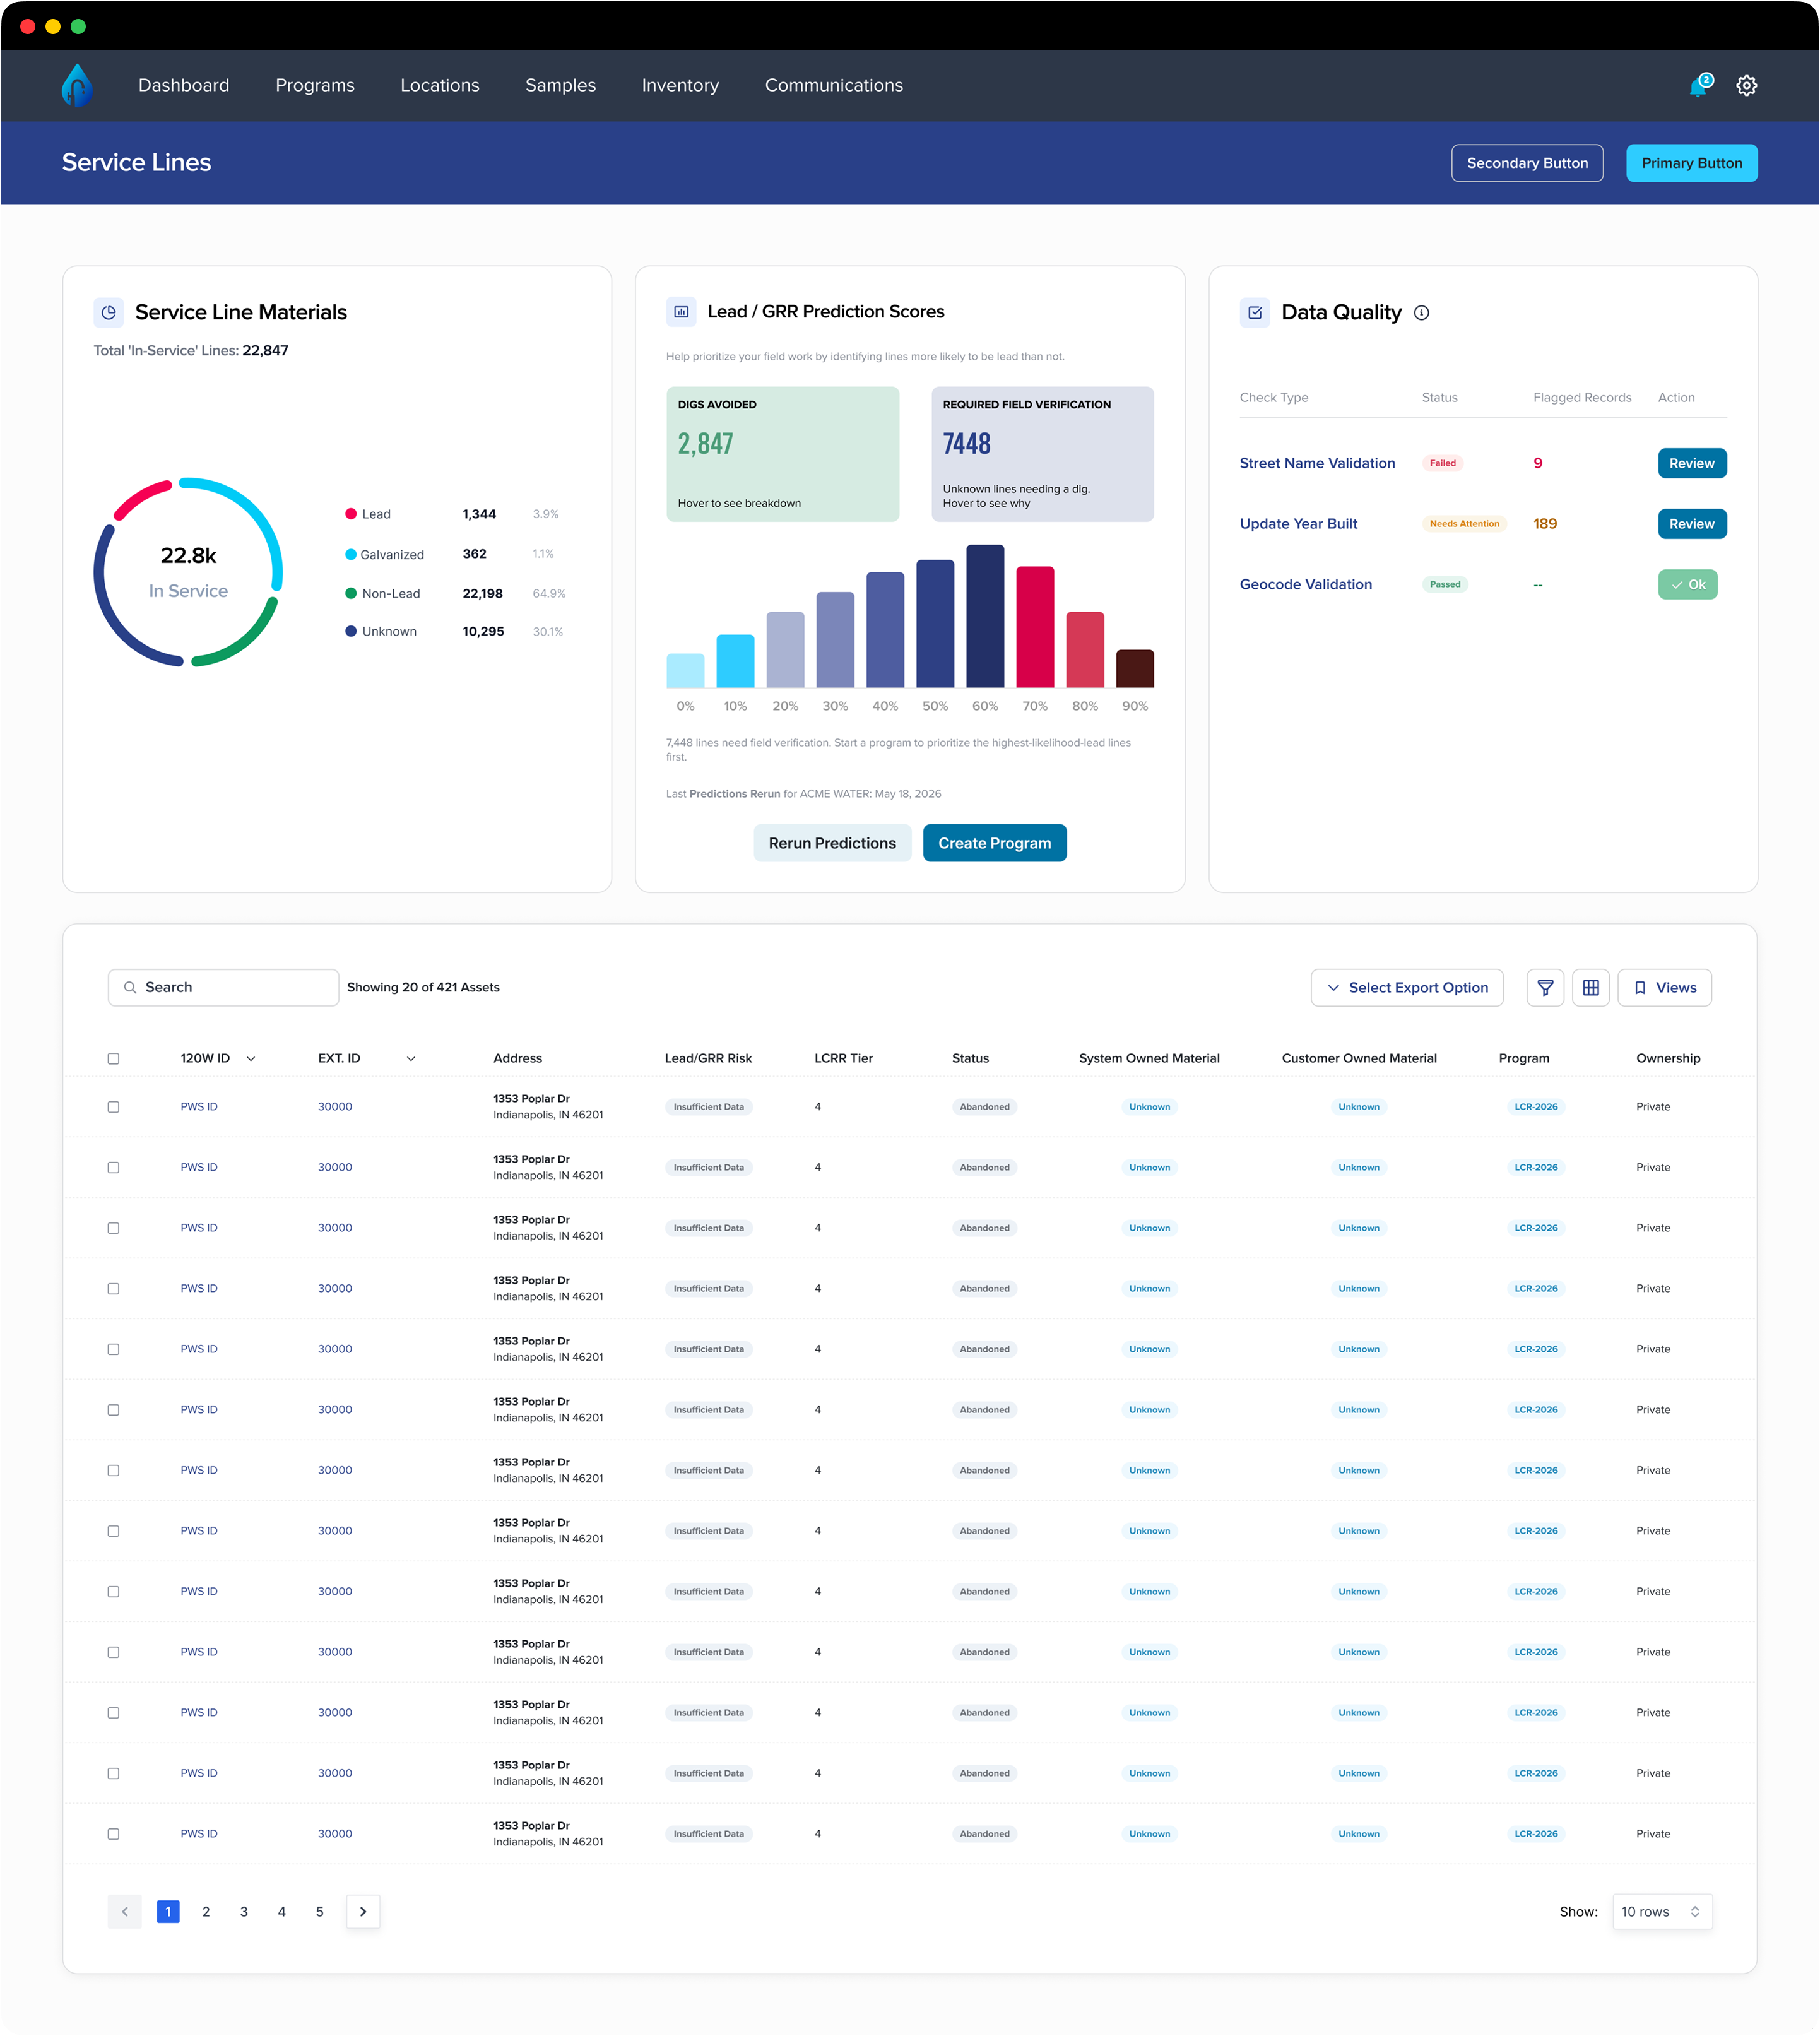
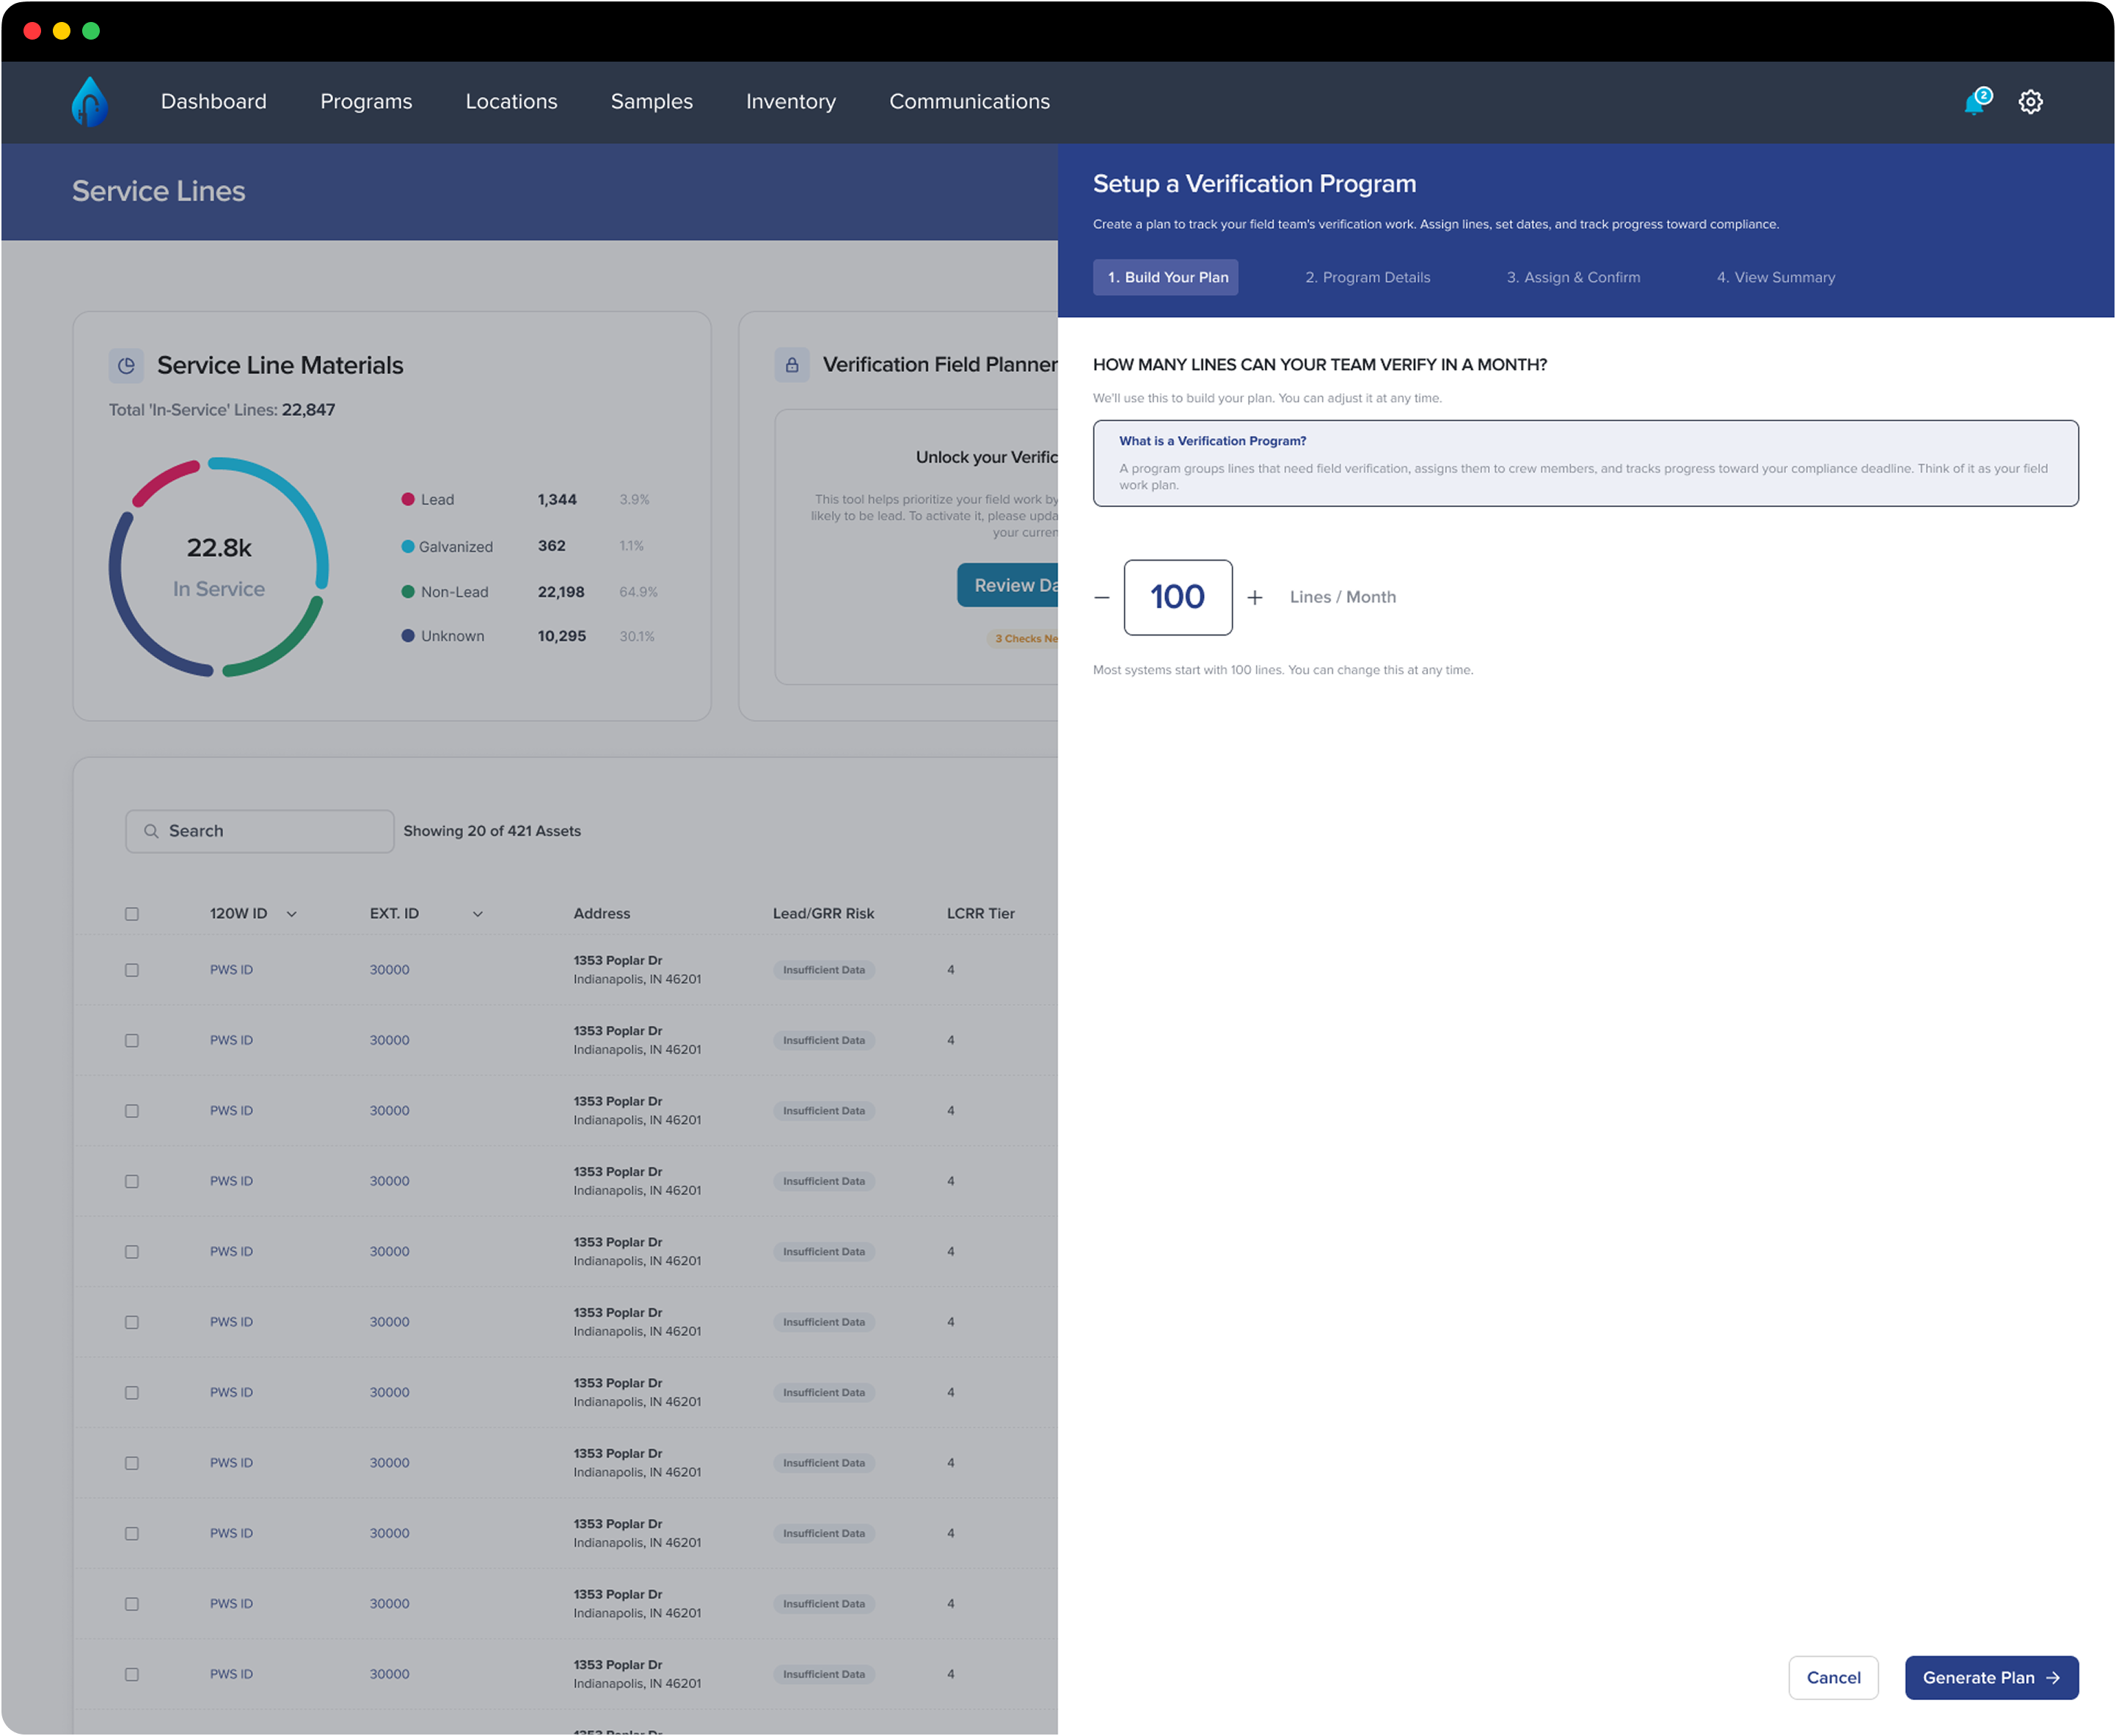
From messy data to a prioritized plan.
Set a monthly capacity. Get a prioritized, mapped list, highest-likelihood-lead first, ready to review before anything's assigned.
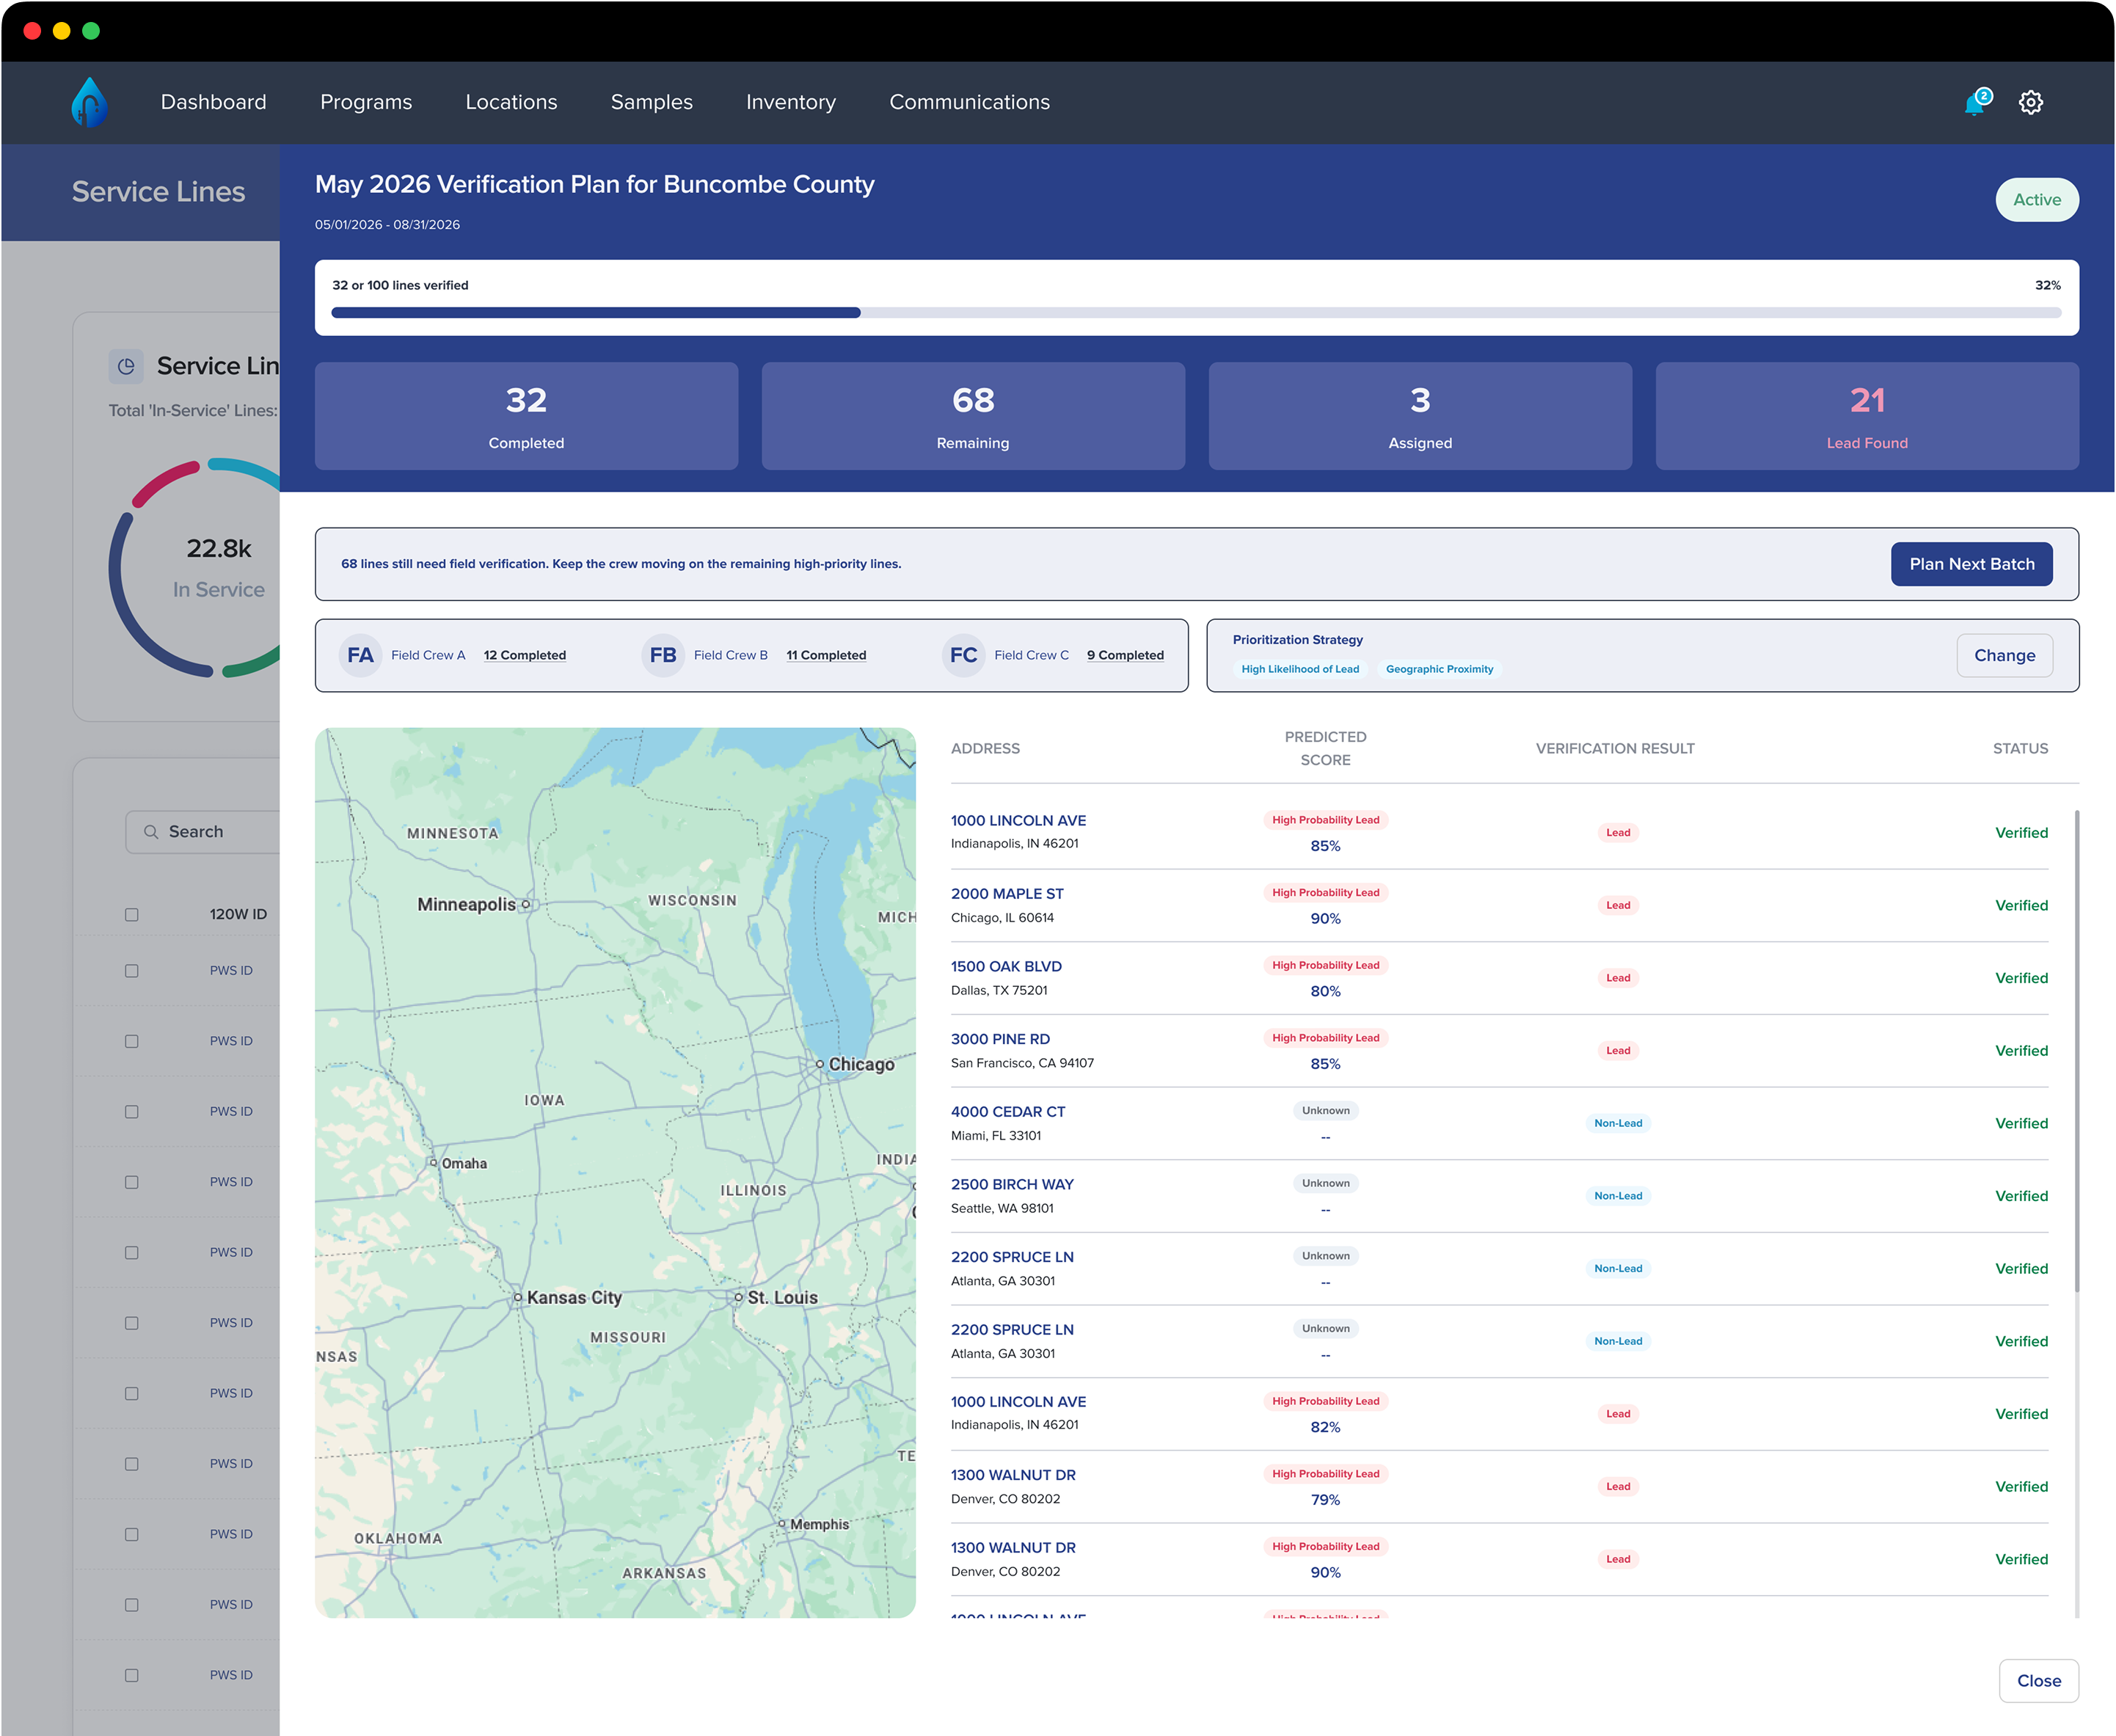
See it running. Then steer what's next.
Crew-by-crew completion, a live map of verified lines, how many turned out to actually be lead, and one click to plan the next batch.
One color, one meaning. One typeface, five weights.
The third rule, made concrete, plus the typeface behind it. These are the prototype's own tokens. Click anything to inspect it.
Counts and percentages use tabular figures, so every digit is the same width and columns line up. Flip the switch to compare.
| Lead | 1,344 | 3.9% |
| Galvanized | 362 | 1.1% |
| Non-Lead | 22,198 | 64.9% |
| Unknown | 10,295 | 30.1% |
Inter throughout. The one exception is monospace, for GPS coordinates and machine-read values.
Direction first. Code second, always.
Forty one tracked versions, May to July. Once one prompt could touch five screens at once, eyeballing each change stopped being reliable, so verification got automated: 118 assertions, 8 checks, run after every change. Slower per edit. Nobody shipped a screen that was secretly broken.
Prototype complete. Not in front of every user yet.
v41, functionally complete across all three areas. Tested with four people, two customers, two internal. Developer handoff is next.
The proof already existed. Utilities just couldn't touch it.
Both hero numbers come from 120Water's own case, not this prototype. Floresville, TX: classifying 700 of 2,200 unknown lines avoided about $105,000 in inspection costs. 95% recall is their own bar for usable at all, below it, their words: "current model won't work."
The business case already existed. What didn't exist was a way to touch it without calling 120Water first.
The best decision was often the one I didn't make yet.
First time running user testing myself. The rule: don't build past what's confirmed. The same three problems kept showing up across different sessions and different people, which is why four short tests beat one long one.